


B. ys x+1

Mathematics, 09.05.2021 07:30, ChloeN8912
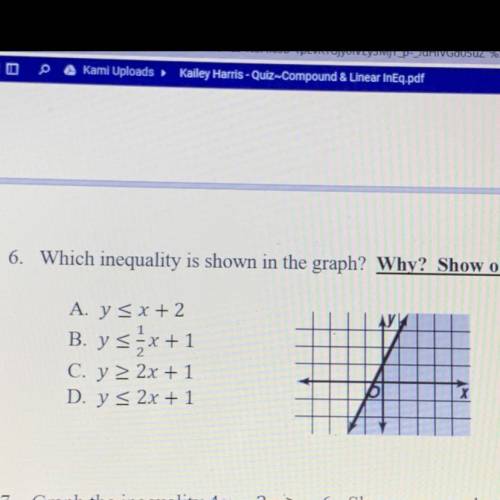
6. Which inequality is shown in the graph? Why? Show or explain.
A. Y S x + 2
B. ys x+1
C. y > 2x + 1
D. y < 2x + 1

Answers: 1
Other questions on the subject: Mathematics
Mathematics, 21.06.2019 18:30, joaquin42
Which of the statements about the graph of the function y = 2x are true? check all of the boxes that apply. the domain is all real numbers x because the exponent of 2 can be any real number when the x-values increases by 1 unit, the y-value multiplies by 2. the y-intercept is (0, 1). the graph never goes below the x-axis because powers of 2 are never negative. the range is all real numbers.
Answers: 1
Mathematics, 21.06.2019 22:00, juhavyen
Determine the domain and range of the given function. the domain is all real numbers all real numbers greater than or equal to –2{x: x = –2, –1, 0, 1, 2}{y: y = –2, –1, 0, 1, 2}. the range is all real numbers all real numbers greater than or equal to –2{x: x = –2, –1, 0, 1, 2}{y: y = –2, –1, 0, 1, 2}.
Answers: 1
Mathematics, 21.06.2019 22:00, MansellS5529
Harry and jay are both flying on the same plane with an airline that randomly assigns seats to passengers. of the 182 total seats on the plane, 62 are window seats, 58 are middle seats, and the rest are aisle seats. what is the approximate probability that both harry and jay will be assigned aisle seats on the same plane? a. 11.48% b. 3.3% c. 2.08% d. 26.26%
Answers: 3
Do you know the correct answer?
6. Which inequality is shown in the graph? Why? Show or explain.
A. Y S x + 2
B. ys x+1
B. ys x+1
Questions in other subjects:

Social Studies, 25.08.2020 21:01

English, 25.08.2020 21:01


