

Mathematics, 08.05.2021 02:20, bjbass899
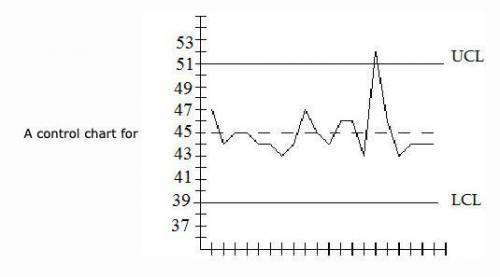
Examine the given run chart or control chart and determine whether the process is within statistical control. If it is not, identify which of the three out-of-statistical-control criteria apply.
A. Process mean is not within statistical control. One of the points lies above the upper control limit.
B. Process mean is not within statistical control. There are points above and below the control limits.
C. Process mean is not within statistical control. There is an upward trend which is indicating an increase in variation.
D. Process mean is within statistical control.

Answers: 1


Other questions on the subject: Mathematics
Mathematics, 21.06.2019 15:40, 1tallison1
What is the first quartile of this data set? 10, 11, 12, 15, 17, 19, 22, 24, 29, 33, 38 a. 12 b. 19 c. 29 d. 10
Answers: 1
Mathematics, 21.06.2019 20:30, gsmgojgoss9651
Cody was 165cm tall on the first day of school this year, which was 10% taller than he was on the first day of school last year.
Answers: 1
Mathematics, 21.06.2019 21:00, recon12759
Is there an x intercept in the equation 60*1.15^x
Answers: 3
Do you know the correct answer?
Examine the given run chart or control chart and determine whether the process is within statistical...
Questions in other subjects:
Mathematics, 23.10.2020 08:01


Mathematics, 23.10.2020 08:01
Mathematics, 23.10.2020 08:01

Mathematics, 23.10.2020 08:01
History, 23.10.2020 08:01
Mathematics, 23.10.2020 08:01


