


Family Budget
We
Utilities
20%
The circle graph below shows the percentages of a...

Mathematics, 07.05.2021 21:50, phamleson8697
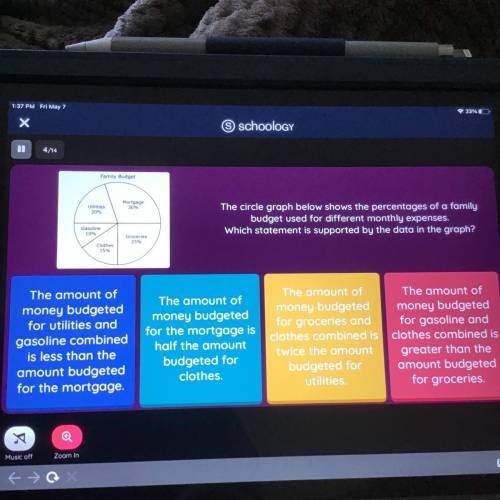
Family Budget
We
Utilities
20%
The circle graph below shows the percentages of a family
budget used for different monthly expenses.
Which statement is supported by the data in the graph?
Gasoline
10%
Groceries
25%
Clothes
15%
The amount of
money budgeted
for utilities and
gasoline combined
is less than the
amount budgeted
for the mortgage.
The amount of
money budgeted
for the mortgage is
half the amount
budgeted for
clothes
The amount of The amount of
money budgeted money budgeted
for groceries and for gasoline and
clothes combined is clothes combined is
twice the amount greater than the
budgeted for amount budgeted
utilities
for groceries.

Answers: 1
Other questions on the subject: Mathematics
Mathematics, 21.06.2019 17:20, dixonmckenzie1429
Asap describe the transformations required to obtain the graph of the function f(x) from the graph of the function g(x). f(x)=-5.8sin x. g(x)=sin x. a: vertical stretch by a factor of 5.8, reflection across y-axis. b: vertical stretch by a factor of 5.8,reflection across x-axis. c: horizontal stretch by a factor of 5.8, reflection across x-axis. d: horizontal stretch by a factor of 5.8 reflection across y-axis.
Answers: 1
Do you know the correct answer?
Questions in other subjects:

History, 04.02.2020 08:40
Mathematics, 04.02.2020 08:40

Computers and Technology, 04.02.2020 08:40

Health, 04.02.2020 08:43

English, 04.02.2020 08:43
Mathematics, 04.02.2020 08:43


