

Mathematics, 07.05.2021 17:10, Lizzyloves8910
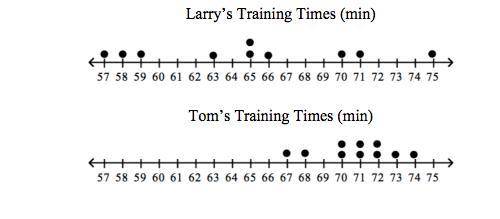
The table below shows the number of minutes Larry and Tom trained for a cross-country run. Select ALL statements that correctly compares the distribution of training times.
A.
The distribution of Tom's training times is somewhat skewed to the right; the distribution of Larry's training times is fairly symmetric.
B.
There is a considerable amount of overlap in training time between data from the two random samples.
C.
There is no variability in Tom's training time.
D.
There is less variability in Larry's training times than in Tom's training times.
E.
There is more variability in Larry's training times than Tom's training times.

Answers: 1


Other questions on the subject: Mathematics
Mathematics, 21.06.2019 22:00, sarahnd6907
Prove sin2a + cos2a - 1 / sin2a + cos2a + 1 = 1 - tana / 1 + cota
Answers: 2
Mathematics, 21.06.2019 22:30, murdocksfamilyouoxvm
Adeposit of 5500 at 6% for 3 years equals
Answers: 2
Do you know the correct answer?
The table below shows the number of minutes Larry and Tom trained for a cross-country run. Select AL...
Questions in other subjects:

Business, 28.07.2019 22:30

Spanish, 28.07.2019 22:30

Chemistry, 28.07.2019 22:30
Mathematics, 28.07.2019 22:30

Biology, 28.07.2019 22:30
Mathematics, 28.07.2019 22:30


