

Mathematics, 06.05.2021 22:30, lovemyboys0404pc662e
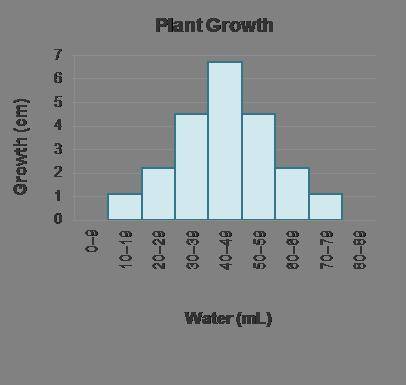
Dean describes the data in the histogram as having a cluster from 30–60 and a peak at 40–49. He says the intervals 0–9 and 80–89 show a 0 frequency. Lastly, he says that the graph is not symmetrical. Why is Dean incorrect?
The graph does not show a peak.
There is no cluster in this data set.
The graph does not show intervals with 0 frequency.
The graph is symmetrical.

Answers: 2


Other questions on the subject: Mathematics
Mathematics, 21.06.2019 15:00, tynitenaire
Idon’t understand this.. will someone ? will mark brainliest along with 20 points.
Answers: 1
Mathematics, 21.06.2019 15:10, sbelgirl2000
Figure abcde is a regular pentagon. segment ae is located at a (2, 1) and e (4, 1). what is the perimeter of abcde? 4 units 6 units 8 units 10 units
Answers: 1
Mathematics, 21.06.2019 23:30, maciemessing2
Drag each number to the correct location on the statements. not all numbers will be used. consider the sequence below. -34, -21, -8, 5, complete the recursively defined function to describe this sequence
Answers: 1
Mathematics, 22.06.2019 00:00, cutie22327
This summer the number of tourists in salem increased 4.5% from last years total of 426000. how many more tourists came to salem this summer
Answers: 1
Do you know the correct answer?
Dean describes the data in the histogram as having a cluster from 30–60 and a peak at 40–49. He says...
Questions in other subjects:
Mathematics, 18.07.2020 14:01


English, 18.07.2020 14:01

History, 18.07.2020 14:01


