


3. Use graph notes and know meanino RANGE and IQR.
9 points
The box plot summarizes the noon...

Mathematics, 06.05.2021 19:00, SKYBLUE1015
3. Use graph notes and know meanino RANGE and IQR.
9 points
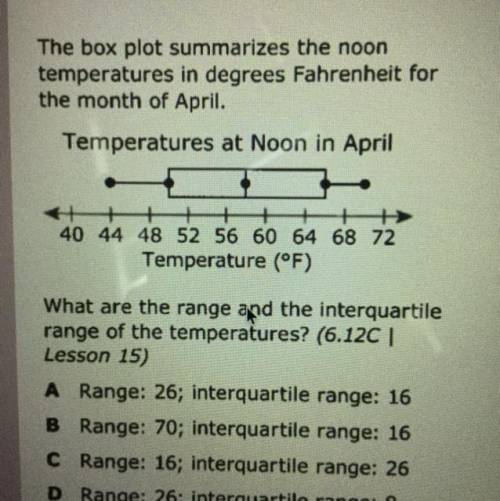
The box plot summarizes the noon
temperatures in degrees Fahrenheit for
the month of April.
Temperatures at Noon in April
+ + +
40 44 48 52 56 60 64 68 72
Temperature (°F)
What are the range and the interquartile
range of the temperatures? (6.12C |
Lesson 15)
A Range: 26; interquartile range: 16
B Range: 70; interquartile range: 16
C Range: 16; interquartile range: 26
D Range: 26; interquartile range: 8

Answers: 3
Other questions on the subject: Mathematics
Mathematics, 22.06.2019 03:00, Samanthas6365
12 3 4 5 6 7 8 9 10 time remaining 42: 01 ryan gathered data about the age of the different dogs in his neighborhood and the length of their tails. which best describes the strength of the correlation, and what is true about the causation between the variables?
Answers: 2
Do you know the correct answer?
Questions in other subjects:
Mathematics, 30.04.2021 05:30
Mathematics, 30.04.2021 05:30
Mathematics, 30.04.2021 05:30
Mathematics, 30.04.2021 05:30

Mathematics, 30.04.2021 05:30

Biology, 30.04.2021 05:30

Mathematics, 30.04.2021 05:30


