

Mathematics, 05.05.2021 21:50, snoopyqueen2597
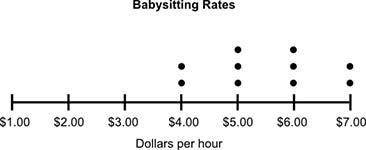
The dot plot below shows the hourly rate of some babysitters in a city:
Which statement best describes the shape of the data?
a. It is symmetric and has no gaps.
b. It is not symmetric and has a peak at $7.00.
c. It is a cluster from $1.00 to $7.00 and has no gaps.
d. It is a cluster from $1.00 to $7.00 and has a peak at $6.00.

Answers: 1


Other questions on the subject: Mathematics
Mathematics, 21.06.2019 17:40, skylerdemi1
A. 127 cm^2 b. 144.5 cm^2 c. 172 cm^2 d. 50 cm^2
Answers: 2
Mathematics, 21.06.2019 21:50, roxanneee2145
5. which description does not guarantee that a quadrilateral is a squar ajo is a parallelogram with perpendicular diagonals 0% has all sides congruent and all angles congruent o has all right angles and has all sides congruent 10% is both a rectangle and a rhombus 30%
Answers: 2
Do you know the correct answer?
The dot plot below shows the hourly rate of some babysitters in a city:
Which statement best descr...
Questions in other subjects:


French, 28.02.2020 19:29

Computers and Technology, 28.02.2020 19:29

Health, 28.02.2020 19:29


