

Mathematics, 05.05.2021 21:40, skyhe34
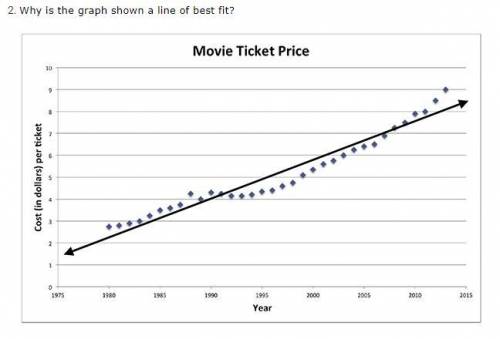
The graph shows a line of best fit because the points are plotted evenly above and below the line.
The graph shows a line of best fit because there is a straight line.
The graph shows a line of best fit because the association is zero.
The graph shows a line of best fit because the points fit around the line.

Answers: 3


Other questions on the subject: Mathematics
Mathematics, 21.06.2019 17:30, rwbrayan8727
Marco has $38.43 dollars in his checking account. his checking account is linked to his amazon music account so he can buy music. the songs he purchases cost $1.29. part 1: write an expression to describe the amount of money in his checking account in relationship to the number of songs he purchases. part 2: describe what the variable represents in this situation.
Answers: 2
Mathematics, 22.06.2019 04:00, AmbitiousAndProud
Which of the following questions describes the equation g + (-4) = -5? a)what number, when added to negative four, is equal to negative five? b)what number, when added to negative five, is equal to negative four? c)what number, when subtracted from negative four, is equal to negative five? d)what number, when subtracted from negative five, is equal to negative four?
Answers: 1
Do you know the correct answer?
The graph shows a line of best fit because the points are plotted evenly above and below the line....
Questions in other subjects:
Mathematics, 27.03.2020 01:23
Mathematics, 27.03.2020 01:23


Physics, 27.03.2020 01:23
Mathematics, 27.03.2020 01:23

History, 27.03.2020 01:23


