


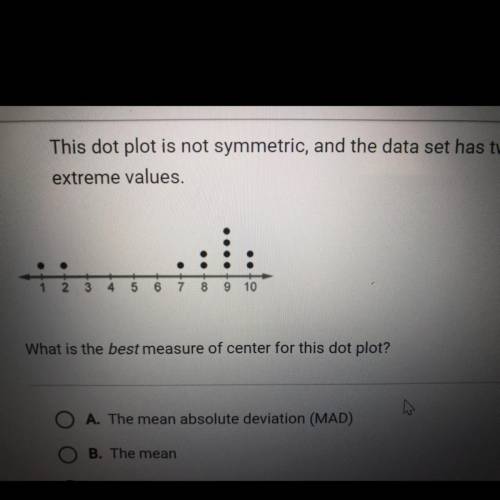
This dot plot is not symmetric, and the data set has two
extreme values.
What is the b...

Mathematics, 05.05.2021 18:50, Sashakimora2020
This dot plot is not symmetric, and the data set has two
extreme values.
What is the best measure of center for this dot plot?
A. The mean absolute
deviation (MAD)
B. The mean
C. The median
D. The interquartile range (IQR)
⚠️Links will be reported ⚠️

Answers: 1
Other questions on the subject: Mathematics
Mathematics, 22.06.2019 00:30, Andrewecolt1993
Long division setup showing an incomplete calculation. 12 is in the divisor, 6839 is in the dividend, and 5 hundreds and 6 tens is written in the quotient. 6000 is subtracted from 6839 to give 839. an unknown value represented by a box is being subtracted from 839. what number should be placed in the box to complete the division calculation?
Answers: 3
Do you know the correct answer?
Questions in other subjects:


Mathematics, 09.12.2019 17:31


