


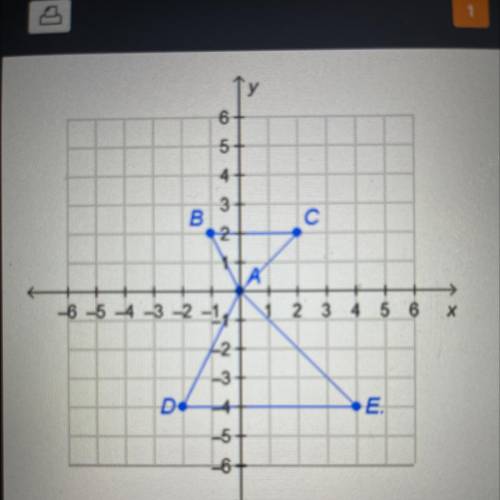
Triangles ABC and ADE are similar, as shown. Which must be true? Check all that apply.
AC=AB
...

Mathematics, 05.05.2021 18:10, SoyAmbia
Triangles ABC and ADE are similar, as shown. Which must be true? Check all that apply.
AC=AB
AC/AE=BC/DE
AC/AD=AB/AE
DE=2BC
BC=2DE
AC=2AE
AE=2AC

Answers: 1
Other questions on the subject: Mathematics
Mathematics, 21.06.2019 15:00, DerikF9478
Saline iv fluid bags cost $64.20 for 24, 1000 ml bags from one supplier. another supplier sells 500 ml bags for $2 each. the hospital uses about 10,000, 1000 ml bags each month. nurses report that about half of the bags are more than half full when they are discarded. if you are going to use only one supplier, which would you choose and how much would you save with that choice? show calculator try it! if you buy 1000 ml bags, how many do you need to buy each month? type your answer in the space provided and click on the check answer button.
Answers: 3
Mathematics, 21.06.2019 16:00, kell22wolf
Part one: measurements 1. measure your own height and arm span (from finger-tip to finger-tip) in inches. you will likely need some from a parent, guardian, or sibling to get accurate measurements. record your measurements on the "data record" document. use the "data record" to you complete part two of this project. name relationship to student x height in inches y arm span in inches archie dad 72 72 ginelle mom 65 66 sarah sister 64 65 meleah sister 66 3/4 67 rachel sister 53 1/2 53 emily auntie 66 1/2 66 hannah myself 66 1/2 69 part two: representation of data with plots 1. using graphing software of your choice, create a scatter plot of your data. predict the line of best fit, and sketch it on your graph. part three: the line of best fit include your scatter plot and the answers to the following questions in your word processing document 1. 1. which variable did you plot on the x-axis, and which variable did you plot on the y-axis? explain why you assigned the variables in that way. 2. write the equation of the line of best fit using the slope-intercept formula $y = mx + b$. show all your work, including the points used to determine the slope and how the equation was determined. 3. what does the slope of the line represent within the context of your graph? what does the y-intercept represent? 5. use the line of best fit to you to describe the data correlation.
Answers: 2
Mathematics, 21.06.2019 16:00, dayanawhite64
Which term best describes the association between variables a and b? no association a negative linear association a positive linear association a nonlinear association a scatterplot with an x axis labeled, variable a from zero to ten in increments of two and the y axis labeled, variable b from zero to one hundred forty in increments of twenty with fifteen points in a positive trend.
Answers: 2
Mathematics, 21.06.2019 17:00, haydencheramie
The vet charges $45 for an office visit and $10 for each vaccination your dog needs. write an eaquation
Answers: 1
Do you know the correct answer?
Questions in other subjects:
Mathematics, 19.05.2021 18:10
Mathematics, 19.05.2021 18:10


Medicine, 19.05.2021 18:10
Mathematics, 19.05.2021 18:10


