

Mathematics, 01.05.2021 22:40, missy922527
I accidentally posted the rest of the questions on another post on my account
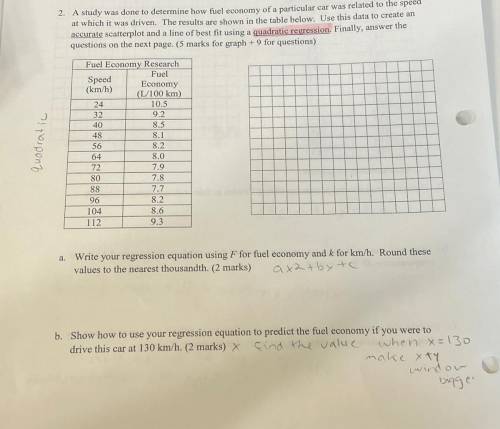
2. A study was done to determine how fuel economy of a particular car was related to the speed
at which it was driven. The results are shown in the table below. Use this data to create an
accurate soatterplot and a line of best fit using a quadratic regression. Finally, answer the
questions on the next page (5 marks for graph + 9 for questions)
Mel Foonomy Research
Fuel
Speed
Boonomy
(U100 km)
103
9,2
8.3
quodratic
04
72
SO
SS
8.2
SO
7.9
7.8
7.7
8.2
8.6
9.3
104
112
Write your regression equation using F for fuel economy and k for km/h. Round these

Answers: 1


Other questions on the subject: Mathematics
Mathematics, 21.06.2019 22:00, alimfelipe
Which two undefined geometric terms always describe figures with no beginning or end?
Answers: 3
Do you know the correct answer?
I accidentally posted the rest of the questions on another post on my account
2. A study was done...
Questions in other subjects:

Social Studies, 07.07.2019 02:30

History, 07.07.2019 02:30
Mathematics, 07.07.2019 02:30

Health, 07.07.2019 02:30
Mathematics, 07.07.2019 02:30
Health, 07.07.2019 02:30


