Multiple Representations. Tables, Graphis,
Table A
Table B
Х
у
х
у
1
1
3
3
2
6
6
2
3
9
9
3
Graph A
Graph B
12
11
10
9
12
11
10
9
8
8
7
7
6
6
Р
5
5
4
4
3
2
2
1 2 3 4 5 6 7 8 9 10 11 12
1 2 3 4 5 6 7 8 9 10 11 12
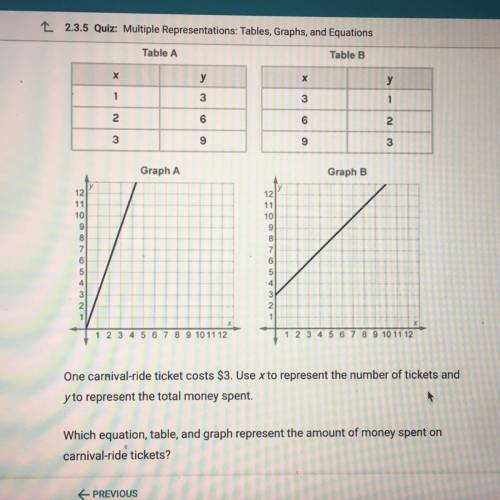
One carnival-ride ticket costs $3. Use x to represent the number of tickets and
y to represent the total money spent.
Which equation, table, and graph represent the amount of money spent on
carnival-ride tickets?
< PREVIOUS
Scores on a university exam are normally distributed with a mean of 78 and a standard deviation of 8. the professor teaching the class declares that a score of 70 or higher is required for a grade of at least “c.” using the 68-95-99.7 rule, what percentage of students failed to earn a grade of at least “c”?