


A zoo has some new exhibits.
In a survey, zoo attendees are asked to choose their favorite.
...

Mathematics, 30.04.2021 18:00, rianna14
A zoo has some new exhibits.
In a survey, zoo attendees are asked to choose their favorite.
The results are shown in the following table.
(a)Find the percentage for each type of animal.
Type of animal Number of zoo attendees Percentage
Koala 648 find percentage
Jaguar 216 find percentage
Anteater 288 find percentage
Gorilla 384 find percentage
Penguin 864 find percentage
(b)Construct a percent bar graph for the data.

Answers: 1
Other questions on the subject: Mathematics
Mathematics, 21.06.2019 15:30, jadajones5313
1. what is the measure of ∠abc? what is the measure of ∠abd?
Answers: 1
Mathematics, 21.06.2019 15:30, sandyyknguyen4837
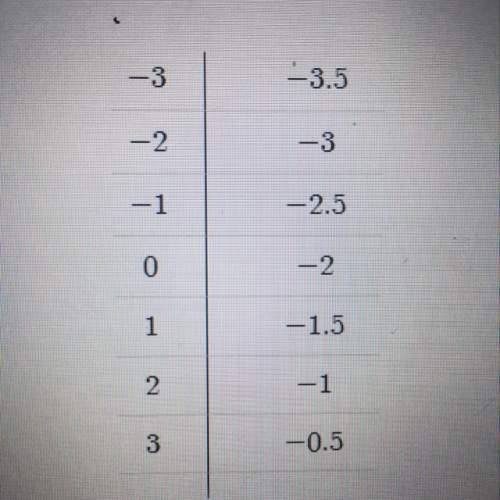
Find the slope of the line below . enter your answer as a fraction or decimal. use a slash mark ( / ) as the fraction bar if necessary
Answers: 3
Mathematics, 21.06.2019 20:00, janeriaw188
Afamily has five members. a mom, a dad, two sisters, & a brother. the family lines up single file. what is the probabillity that the mom is at the front of the line
Answers: 1
Do you know the correct answer?
Questions in other subjects:

English, 03.08.2019 07:30

Geography, 03.08.2019 07:30

Biology, 03.08.2019 07:30

Social Studies, 03.08.2019 07:30
Mathematics, 03.08.2019 07:30

Chemistry, 03.08.2019 07:30
English, 03.08.2019 07:30


