


Player 1
Player 2
The box plot shows data that was
collected on two basketball players...

Mathematics, 30.04.2021 06:10, crun
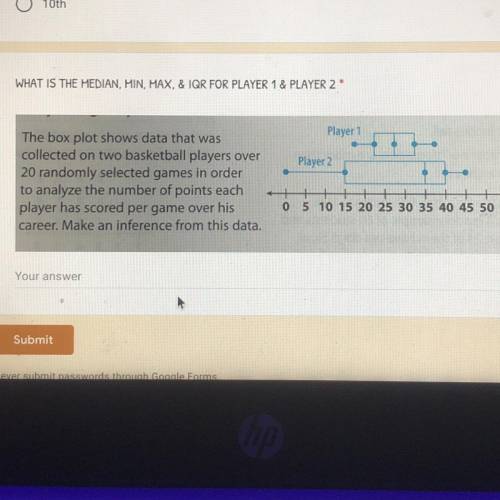
Player 1
Player 2
The box plot shows data that was
collected on two basketball players over
20 randomly selected games in order
to analyze the number of points each
player has scored per game over his
career.
Please help ASAP

Answers: 3
Other questions on the subject: Mathematics
Mathematics, 21.06.2019 13:50, sweetcandy16gaming
What are the vertical asymptotes of the function f(x) =5x+5/x2 + x-2
Answers: 1
Mathematics, 21.06.2019 18:00, amandaclark255
Last year, a state university received 3,560 applications from boys. of those applications, 35 percent were from boys who lived in other states. part a)how many applications did the university receive from boys who lived in other states? part b)applications to the university from boys represented 40percent of all applications. how many applications did the university receive in all? i don't how to do part b so me and plz tell how you got your answer
Answers: 1
Mathematics, 21.06.2019 19:50, ghwolf4p0m7x0
The graph shows the distance kerri drives on a trip. what is kerri's speed . a. 25 b.75 c.60 d.50
Answers: 1
Do you know the correct answer?
Questions in other subjects:

English, 29.08.2021 20:30
Mathematics, 29.08.2021 20:30

Social Studies, 29.08.2021 20:30

Mathematics, 29.08.2021 20:30

History, 29.08.2021 20:30
Mathematics, 29.08.2021 20:30

Computers and Technology, 29.08.2021 20:30


