

Mathematics, 30.04.2021 03:10, Demondevilg
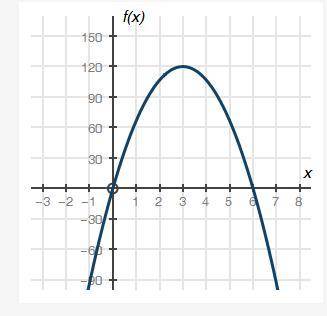
The graph below shows a company's profit f(x), in dollars, depending on the price of pens x, in dollars, sold by the company: Part A: What do the x-intercepts and maximum value of the graph represent? What are the intervals where the function is increasing and decreasing, and what do they represent about the sale and profit? (4 points) Part B: What is an approximate average rate of change of the graph from x = 3 to x = 5, and what does this rate represent? (3 points) Part C: Describe the constraints of the domain. (3 points)

Answers: 3


Other questions on the subject: Mathematics
Mathematics, 21.06.2019 18:00, davidleew24
What can you determine about the solutions of this system
Answers: 1
Do you know the correct answer?
The graph below shows a company's profit f(x), in dollars, depending on the price of pens x, in doll...
Questions in other subjects:

Mathematics, 20.09.2020 16:01
Mathematics, 20.09.2020 16:01

Mathematics, 20.09.2020 16:01

Biology, 20.09.2020 16:01
Mathematics, 20.09.2020 16:01


