

Mathematics, 29.04.2021 03:00, bella354
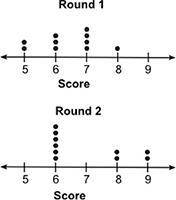
The dot plots below show the scores for a group of students who took two rounds of a quiz:
Which of the following inferences can be made using the dot plot?
The range of each round is the same.
There is no overlap between the data.
Round 1 scores were higher than round 2 scores.
Round 2 scores were lower than round 1 scores.

Answers: 1


Other questions on the subject: Mathematics
Mathematics, 21.06.2019 17:30, liaholmes8
If i have one apple and give you the apple, how many apples do i have?
Answers: 2
Mathematics, 21.06.2019 18:00, sophiamoser
Julius sold five times as many computers as sam sold last year. in total, they sold 78 computers. how many computers did julius sell?
Answers: 1
Mathematics, 21.06.2019 18:50, abbieT6943
Find the greatest common factor of the followig monomials 21u^5v,3u^4v^6, and 3u^2v^5
Answers: 1
Do you know the correct answer?
The dot plots below show the scores for a group of students who took two rounds of a quiz:
Which o...
Questions in other subjects:
Mathematics, 24.02.2021 02:00

Advanced Placement (AP), 24.02.2021 02:00
Mathematics, 24.02.2021 02:00


Mathematics, 24.02.2021 02:00


