

Mathematics, 28.04.2021 23:30, savage5447
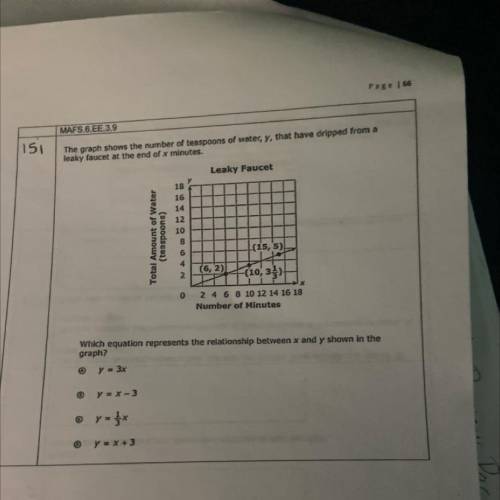
The graph shows the number of teaspoons of water, y, that have dripped from a
leaky faucet at the end of x minutes.
Leaky Faucet
Which equation represents the relationship between x and y shown in the
graph?
A. Y= 3х
B. Y =X - 3
C. Y= 1/3x
D. Y= x + 3

Answers: 2


Other questions on the subject: Mathematics
Mathematics, 21.06.2019 16:00, SavyBreyer
Use the function f(x) is graphed below. the graph of the function to find, f(6). -2 -1 1 2
Answers: 1
Mathematics, 21.06.2019 21:00, kprincess16r
Choose the equation below that represents the line that passes through the point (2, 4) and has a slope of 3. a) y − 4 = 3(x − 2) b) y − 2 = 3(x − 4) c) y + 4 = 3(x + 2) d) y + 2 = 3(x + 4)
Answers: 1
Mathematics, 21.06.2019 22:30, campilk5
Sketch the vector field vector f( vector r ) = 8vector r in the xy-plane. select all that apply. the length of each vector is 8. the lengths of the vectors decrease as you move away from the origin. all the vectors point away from the origin. all the vectors point in the same direction. all the vectors point towards the origin. the lengths of the vectors increase as you move away from the origin.
Answers: 2
Do you know the correct answer?
The graph shows the number of teaspoons of water, y, that have dripped from a
leaky faucet at the...
Questions in other subjects:

English, 26.03.2020 05:45
Mathematics, 26.03.2020 05:45

English, 26.03.2020 05:45
Mathematics, 26.03.2020 05:45


