

Mathematics, 28.04.2021 18:30, user1234536
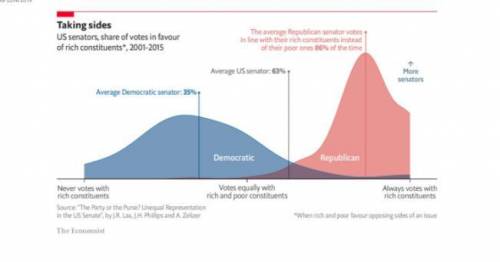
The following graph from the Economist, July 22, 2019 (Link to Economist Article) shows two curves that are approximately normal.
What is the mean of each curve?
Estimate the standard deviation (using the point of inflection or range rule of thumb).
What do the mean and standard deviation tell you about the way Republicans and Democrats in Congress vote?
After your initial post, respond to two others in your group. What conclusions did you share, and what did you interpret differently?

Answers: 3


Other questions on the subject: Mathematics
Mathematics, 21.06.2019 20:00, Kalle91106
Can someone factor this fully? my friend and i have two different answers and i would like to know if either of them is right. you in advance. a^2 - b^2 + 25 + 10a
Answers: 1
Mathematics, 21.06.2019 21:00, newsome1996p4ggft
5x−4≥12 or 12x+5≤−4 can you with this problem
Answers: 3
Mathematics, 21.06.2019 21:30, InvictusPain4777
Yo need asap pls ! markin da brainiest too !
Answers: 1
Do you know the correct answer?
The following graph from the Economist, July 22, 2019 (Link to Economist Article) shows two curves t...
Questions in other subjects:


Mathematics, 05.05.2020 21:27


Mathematics, 05.05.2020 21:27
Mathematics, 05.05.2020 21:27


