Y
20
15
10
..
.
5
0
0.5
1
1.5
2 X
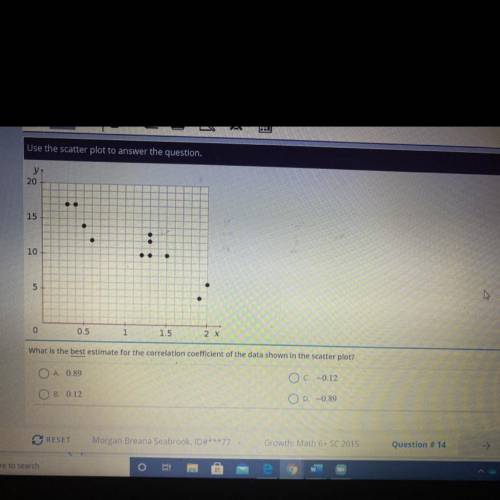
What is the best estimate for the correlation coefficient of the data shown in the scatter plot?
A 0.89
OC -0,12
OD. -0,89
B. 0.12
Which is a logical conclusion based on the given information? a. figure abcd is a rhombus by the definition of a rhombus. b. segment ac is congruent to segment dc by cpctc. c. angle acb is congruent to angle adc by the angle-side-angle theorem. d. triangle acd is congruent to triangle cab by the hypotenuse-leg theorem.