

Mathematics, 28.04.2021 15:30, teetee7561
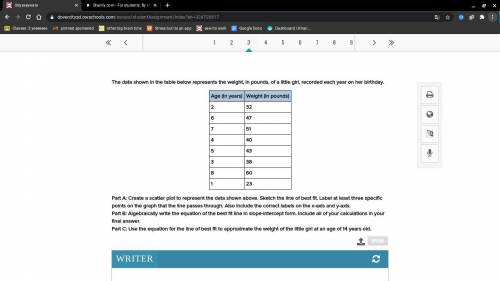
The data shown in the table below represents the weight, in pounds, of a little girl, recorded each year on her birthday.
Age (in years) Weight (in pounds)
2 32
6 47
7 51
4 40
5 43
3 38
8 60
1 23Part A: Create a scatter plot to represent the data shown above. Sketch the line of best fit. Label at least three specific points on the graph that the line passes through. Also include the correct labels on the x-axis and y-axis.
Part B: Algebraically write the equation of the best fit line in slope-intercept form. Include all of your calculations in your final answer.
Part C: Use the equation for the line of best fit to approximate the weight of the little girl at an age of 14 years old.
(i also included the picture

Answers: 3


Other questions on the subject: Mathematics
Mathematics, 21.06.2019 19:30, joselinegarciaowyrpf
Asquare picture with sides of 32 inches is to be mounted on a square mat with sides of 52 inches. find the area of the mat that will remain uncovered by the picture.
Answers: 1
Mathematics, 22.06.2019 02:00, arlabbe0606
(30 points). the population of a city is 45,000 and decreases 2% each year. if the trend continues, what will the population be aer 15 yrs
Answers: 2
Do you know the correct answer?
The data shown in the table below represents the weight, in pounds, of a little girl, recorded each...
Questions in other subjects:

Health, 17.10.2019 16:00

Social Studies, 17.10.2019 16:00


Biology, 17.10.2019 16:00
Mathematics, 17.10.2019 16:00
Mathematics, 17.10.2019 16:00
History, 17.10.2019 16:00


