

Mathematics, 27.04.2021 21:20, RandomLollipop
29 POINTS I already solved half of it pls help on part 4 and down.
YOUR ASSIGNMENT: Desert Temperatures
In this assignment, you may work alone, with a partner, or in a small group. Discuss the results of your work and/or any lingering questions with your teacher.
Temperature in the desert can be modeled by the function C(t), where t represents hours after midnight (0 ≤ t ≤ 24), and C is the temperature measured in degrees Celsius. Examine what happens to the graph when you transform the function to degrees Fahrenheit.
Circle the desert you picked:
Sahara Desert
Patagonian Desert
Death Valley California(I choose this one)
Exploring Degrees Celsius
1. Fill out the following chart to find the temperatures for t = 12 (noon) and t = 24 (midnight). (2 points: 1 point for each row)
t
C(t) = –0.30(t – 12)2 + 40
0
12
C(t) = -0.30 (12 - 12)² + 40
C(t) = -0.30 (0)² + 40
C(t) = 40
24
C(t) = -0.30 (24 - 12)² + 40
C(t) = -0.30 (12)² + 40
C(t) = -0.30 × 144 + 40
C(t) = - 43.2 + 40
C(t) = -3.2
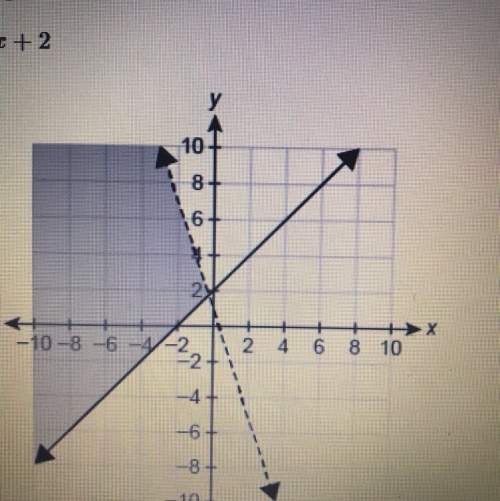
2. Plot the three points from the chart onto the graph below. Use the plotted points to sketch the graph of C(t) = –0.30(t – 12)2 + 40. (3 points: 2 points for correct coordinates, 1 point for correct shape)
Convert the Function to Degrees Fahrenheit:
3. Suppose you want to represent the desert temperature in degrees Fahrenheit instead. How would you transform the function C(t) to make the new function, F(t)? (2 points: 1 point for each transformation)
Note: The conversion rule for Celsius to Fahrenheit is .
F(t)=9/5{–0.30 (t – 12)² + 40}+32
F(t) = -0.54 (t – 12)² + 72 + 32
F(t) = -0.54 (t – 12)² + 104
4. Take your values from the previous chart (in question 2) and convert them from Celsius to Fahrenheit. Follow the example below, and use the conversion rule to fill out the chart for degrees Fahrenheit when t = 12 and t = 24. (2 points: 1 point for each row)
t
0
12
24
5. Use the conversion formula to write the equation for the new function, F(t).
(4 points: 2 points for setting up the equation, 2 points for the answer)
Hint: Substitute the equation for C(t) into .
6. Plot the points from the Fahrenheit chart in question 4 onto the graph below. Use the plotted points to sketch out the graph of F(t). (3 points: 2 points for correct coordinates, 1 point for correct shape)
7. Compare the graph in question 6 (F(t)) with the graph in question 2 (C(t)). What changes were made to the graph of C(t) to transform it to F(t)? (1 point)

Answers: 3


Other questions on the subject: Mathematics
Mathematics, 21.06.2019 13:30, carlalopezelox9533
Patel’s class voted on their favorite color. patel plans to make a circle graph to display the results. which statements are true about the circle graph patel can create? check all that apply.
Answers: 2
Mathematics, 21.06.2019 17:30, leapfroggiez
Enter the missing numbers in the boxes to complete the table of equivalent ratios. time (min) distance (km)? 36 9? 1512 ?
Answers: 3
Mathematics, 21.06.2019 20:00, allycoops666666
Sarah took the advertising department from her company on a round trip to meet with a potential client. including sarah a total of 11 people took the trip. she was able to purchase coach tickets for $280 and first class tickets for $1280. she used her total budget for airfare for the trip, which was $6080. how many first class tickets did she buy? how many coach tickets did she buy?
Answers: 1
Mathematics, 22.06.2019 03:30, davidsouth444
Calculate the mean value (expected value) of the following discrete variable x (10 points): x = 0, 1, 2, 3, 4, 5, 6 p(x) = 0.2, 0.2, 0.15, 0.15, 0.15, 0.1, 0.05
Answers: 1
Do you know the correct answer?
29 POINTS I already solved half of it pls help on part 4 and down.
YOUR ASSIGNMENT: Desert Tempera...
Questions in other subjects:

Mathematics, 29.03.2021 18:20

History, 29.03.2021 18:20
History, 29.03.2021 18:20
Mathematics, 29.03.2021 18:20


