4
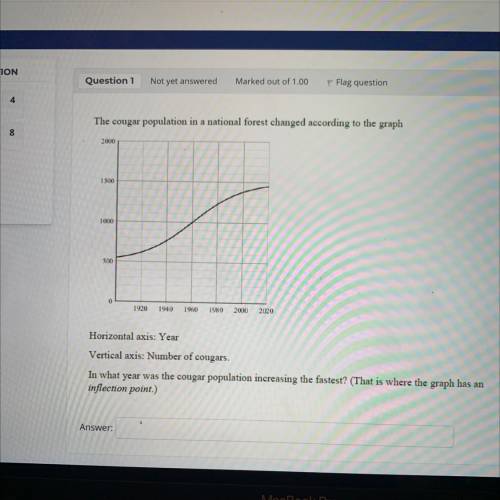
The cougar population in a national forest changed according to the graph
8
2000
1500
1000
500
1920
1940
1960
1980
2000
2020
Horizontal axis: Year
Vertical axis: Number of cougars.
In what year was the cougar population increasing the fastest? (That is where the graph has an
inflection point.)
Mikael, hema and 5 friends will run an event. they will wear either a red shirt or red baseball hat during the event. they want to spend exactley $40. shirts cost $8 each and caps cost $4 each.