


PLEASE HELP
Select ALL the correct answers.
The histogram below shows the number of goals sc...

Mathematics, 25.04.2021 21:20, Queenofpizza
PLEASE HELP
Select ALL the correct answers.
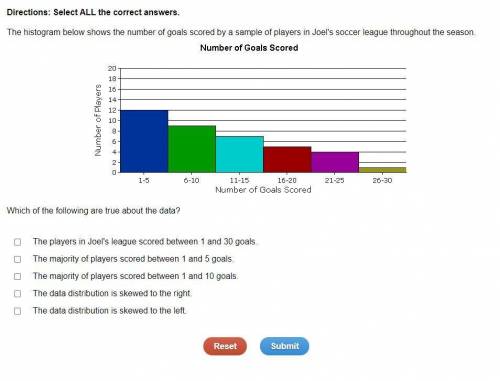
The histogram below shows the number of goals scored by a sample of players in Joel's soccer league throughout the season.
Which of the following are true about the data?
The players in Joel's league scored between 1 and 30 goals.
The majority of players scored between 1 and 5 goals.
The majority of players scored between 1 and 10 goals.
The data distribution is skewed to the right.
The data distribution is skewed to the left.

Answers: 2
Other questions on the subject: Mathematics
Mathematics, 22.06.2019 01:00, yselahernandez02
Suppose the equation ||x-a|-b|=2008 has 3 distinct real roots and a not =0. find the value of b.
Answers: 1
Do you know the correct answer?
Questions in other subjects:
Mathematics, 26.06.2019 23:10

Mathematics, 26.06.2019 23:10
Mathematics, 26.06.2019 23:10

Chemistry, 26.06.2019 23:10
History, 26.06.2019 23:10


