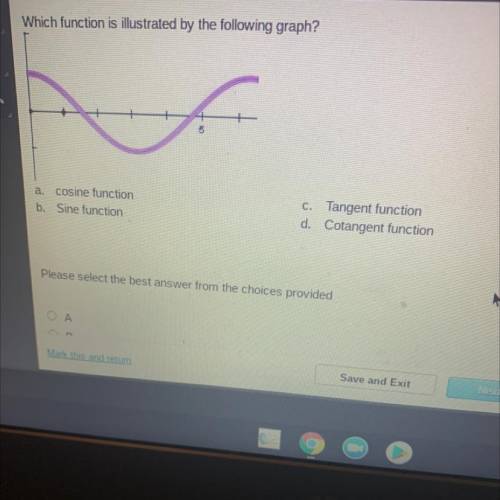
Which function is illustrated by the following graph?
+
5
a.
cosine function
Sine function
b.
C. Tangent function
d. Cotangent function
Please select the best answer from the choices provided
A
Aretha wanted to gather data about the cost of local bowling leagues in her area. she plotted the data and determined that the average bowling league costs consist of a one-time registration fee and a monthly fee modeled by the equation y = 15x + 20. identify and interpret the y-intercept in this model. the y-intercept is 20. this is the cost per month. the y-intercept is 20. this is the cost of registration. the y-intercept is 15. this is the cost of registration. the y-intercept is 15. this is the cost per month.
The birth weights of newborn babies in the unites states follow in a normal distrubution with a mean of 3.4 kg and standard deviation of 0.6 kg. reaserches interested in studying how. children gain weights decide to take random samples of 100 newborn babies and calculate the sample mean birth weights for each sample