

Mathematics, 24.04.2021 21:50, joshua1255
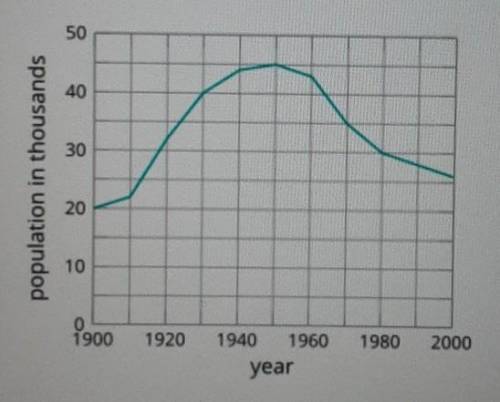
The graph shows the population of a city from 1900 to 2000. What is the average rate of change of the population between 1950 and 1980? Please help! I attached a photo of the graph.

Answers: 2


Other questions on the subject: Mathematics
Mathematics, 21.06.2019 14:10, uhhgray
Students are given 3 minutes for each multiple-choice question and 5 minutes for each free-response question on a test. there are 15 questions on the test, and students are given 51 minutes to take it. how many multiple-choice questions are on the test?
Answers: 1
Mathematics, 21.06.2019 18:00, britneyvaughn219
Agraph of a trapezoid can have diagonals with slopes that are negative reciprocals and two pairs of adjacent sides that are congruent, true or false, and why
Answers: 1
Mathematics, 21.06.2019 18:00, ineedhelp2285
Yesterday i ran 5 miles. today, i ran 3.7 miles. did my percent increase, decrease or is it a percent error? plz i need
Answers: 2
Do you know the correct answer?
The graph shows the population of a city from 1900 to 2000. What is the average rate of change of th...
Questions in other subjects:


Mathematics, 28.05.2020 23:09
Mathematics, 28.05.2020 23:09


