

Mathematics, 23.04.2021 22:50, danding1593
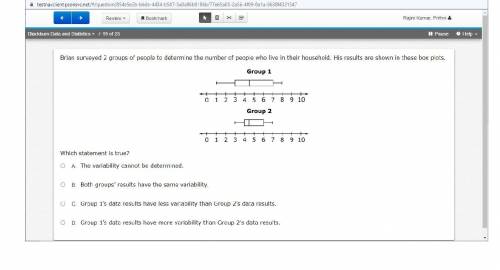
Brian surveyed 2 groups of people to determine the number of people who live in their household. His results are shown in these box plots. Which statement is true? A. The variability cannot be determined. B. Both groups’ results have the same variability. C. Group 1’s data results have less variability than Group 2’s data results. D. Group 1’s data results have more variability than Group 2's data results.

Answers: 3


Other questions on the subject: Mathematics
Mathematics, 21.06.2019 18:30, santiagobermeo32
What is the value of x in the following equation? -3x-2=2x+8
Answers: 1
Mathematics, 21.06.2019 23:00, daedae96
Answer this two poles, ab and ed, are fixed to the ground with the of ropes ac and ec, as shown: two right triangles abc and edc have a common vertex c. angle abc and edc are right angles. ab is labeled 13 feet, ac is labeled 15 feet, ec is labeled 10 feet, and ed is labeled 4 feet. what is the approximate distance, in feet, between the two poles? 11.14 feet16.65 feet14.35 feet15.59 feet
Answers: 1
Do you know the correct answer?
Brian surveyed 2 groups of people to determine the number of people who live in their household. His...
Questions in other subjects:
Mathematics, 21.04.2021 05:30
Mathematics, 21.04.2021 05:30

English, 21.04.2021 05:30


Chemistry, 21.04.2021 05:30

Geography, 21.04.2021 05:30


