


Question 3 of 45
The scatterplot shown below represents data for each of the years from 2006
...

Mathematics, 23.04.2021 20:40, mia36492
Question 3 of 45
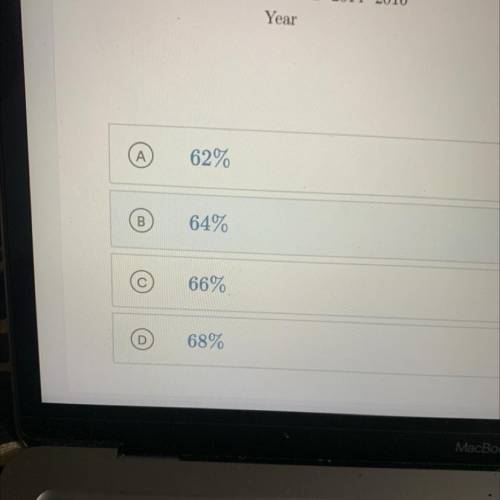
The scatterplot shown below represents data for each of the years from 2006
to 2015. The plot shows the percent of people 62 years of age and older who
were working and then retired during each of those years. If this trend continued,
which of the following best predicts the percent who retired in 2016?

Answers: 3
Other questions on the subject: Mathematics
Mathematics, 21.06.2019 13:00, dontcareanyonemo
Find and simplify an expression for the area of five rows of x squares with side lengths of x centimeters .
Answers: 3
Mathematics, 21.06.2019 14:10, javier04052000
Rachel reads 1/5 of the pages of a book plus 12 pages on the first day. on the second day, she reads 1/4 of the remaining pages plus 15 pages. on the third day, she reads 1/3 of the remaining pages plus 18 pages. on the fourth day, she reads the remaining 70 pages. how many total pages are in the book?
Answers: 2
Mathematics, 21.06.2019 20:20, kenken2583
Complete the input-output table for the linear function y = 3x. complete the input-output table for the linear function y = 3x. a = b = c =
Answers: 2
Do you know the correct answer?
Questions in other subjects:

Business, 26.07.2021 21:00

English, 26.07.2021 21:00

Mathematics, 26.07.2021 21:00

Spanish, 26.07.2021 21:00

History, 26.07.2021 21:00
Mathematics, 26.07.2021 21:00
Mathematics, 26.07.2021 21:00


