

Mathematics, 23.04.2021 17:20, cj31150631
Step 1: The data for each bird is on page 2. For each bird you need to determine the following:
The maximum height
The axis of symmetry
The distance traveled
Step 2: Create a graph representing each bird’s trajectory. Include the pigs on the graph.
Step 3: Answer the following questions:
Which bird flew the highest?
Which bird flew the longest?
Which bird hit which pig?
Step 4: Present your information any way you wish. Make sure that your project includes all parts (with your calculations) and is neat.
Optional Extension: Write an equation for the flight path of each bird.
Red Bird
“RED”
The table below shows partial data points for Red bird’s flight path
x
6
8
10
12
14
16
18
20
22
24
26
y
0
9
16
21
24
25
24
21
16
9
0
Blue Birds
“Jim”, “Jake”, “Jay”
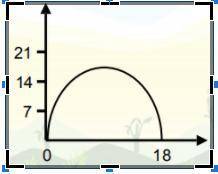
Blue bird’s flight is represented by the graph below:
Yellow Bird ( the graph)
“Chuck”
Yellow bird’s flight path can be modeled by the quadratic equation:
y = -x2 + 20x - 64
Black Bird
“Bomb”
Black bird starts his flight path from (2, 0). His flight path reaches a maximum height of 20 yards and lands at point (38, 0).
King Pig
King Pig is located at point (20, 21).
Mustache Pig
Mustache Pig is located at point (13, 27).

Answers: 3


Other questions on the subject: Mathematics
Mathematics, 21.06.2019 15:30, adriana145
With these: 18/36 = 1/? missing number change 1 5/8 to improper fraction. change 19/5 to a mixed number.
Answers: 3
Mathematics, 21.06.2019 16:30, lilrel8602
Karen is financing $291,875 to purchase a house. she obtained a 15/5 balloon mortgage at 5.35%. what will her balloon payment be? a. $220,089.34 b. $219,112.46 c. $246,181.39 d. $230,834.98
Answers: 2
Mathematics, 21.06.2019 17:40, zaygonegraduate
Follow these steps using the algebra tiles to solve the equation −5x + (−2) = −2x + 4. 1. add 5 positive x-tiles to both sides and create zero pairs. 2. add 4 negative unit tiles to both sides and create zero pairs. 3. divide the unit tiles evenly among the x-tiles. x =
Answers: 1
Mathematics, 21.06.2019 18:00, cashhd1212
The given dot plot represents the average daily temperatures, in degrees fahrenheit, recorded in a town during the first 15 days of september. if the dot plot is converted to a box plot, the first quartile would be drawn at __ , and the third quartile would be drawn at __ link to graph: .
Answers: 1
Do you know the correct answer?
Step 1: The data for each bird is on page 2. For each bird you need to determine the following:
Th...
Questions in other subjects:


Biology, 03.12.2020 01:50

History, 03.12.2020 01:50

Medicine, 03.12.2020 01:50
Health, 03.12.2020 01:50
Mathematics, 03.12.2020 01:50


