

Mathematics, 22.04.2021 16:30, gomezyonathan93
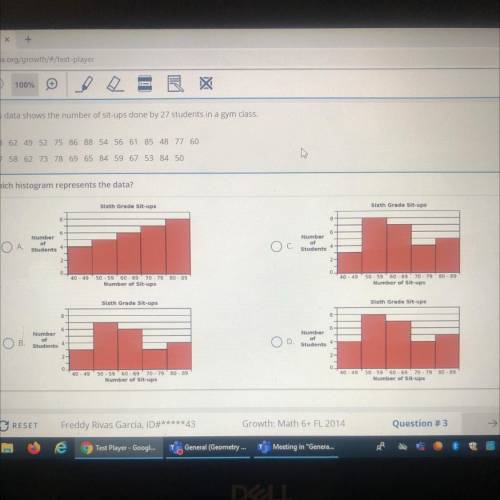
This data shows the number of sit-ups done by 27 students in a gym class.
58 62 49 52 75 86 88 54 56 61 85 48 77 60
47 58 62 73 78 69 65 84 59 67 53 84 50
Which histogram represents the data?

Answers: 1


Other questions on the subject: Mathematics
Mathematics, 21.06.2019 12:40, thomaswillmsn7496
The graph below shows the amount of money left in the school’s desk fund, f, after d desks have been purchased. for each new desk that is purchased, by how much does the amount of money left in the school’s desk fund decrease?
Answers: 1
Mathematics, 21.06.2019 14:00, moutchyjoseph
Ateacher asked his students to vote for an animal to be their class pet. five-eighteenths of the students voted for a rabbit, voted for a snake, and voted for a hamster. which statement is true? more students voted for a hamster than a snake. more students voted for a snake than a rabbit. more students voted for a rabbit than a hamster. more students voted for a snake than a hamster.
Answers: 3
Mathematics, 21.06.2019 18:00, whocares1234
How many triangles can be drawn with side lengths 4 centimeters, 4.5 centimeters, and 9 centimeters? explain
Answers: 1
Do you know the correct answer?
This data shows the number of sit-ups done by 27 students in a gym class.
58 62 49 52 75 86 88 54...
Questions in other subjects:

Mathematics, 22.04.2020 17:26
Mathematics, 22.04.2020 17:26


