

Mathematics, 21.04.2021 08:20, umimgoingtofail
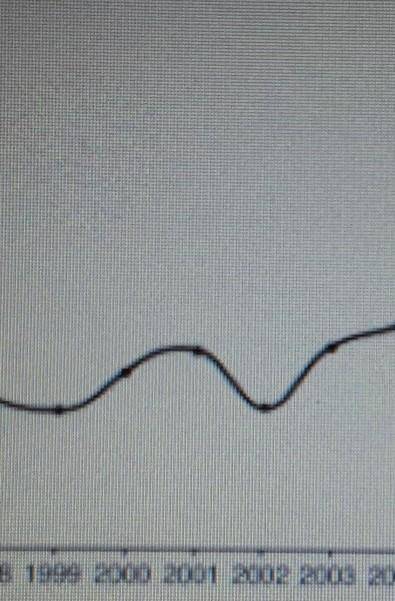
the graph below shows the average price of gasoline, in dollars, for the years 1997 to 2007.what is the approximate range of this graph

Answers: 2


Other questions on the subject: Mathematics
Do you know the correct answer?
the graph below shows the average price of gasoline, in dollars, for the years 1997 to 2007.what is...
Questions in other subjects:


Mathematics, 23.11.2019 12:31
Biology, 23.11.2019 12:31
Mathematics, 23.11.2019 12:31


