

Mathematics, 20.04.2021 21:30, bubl6010
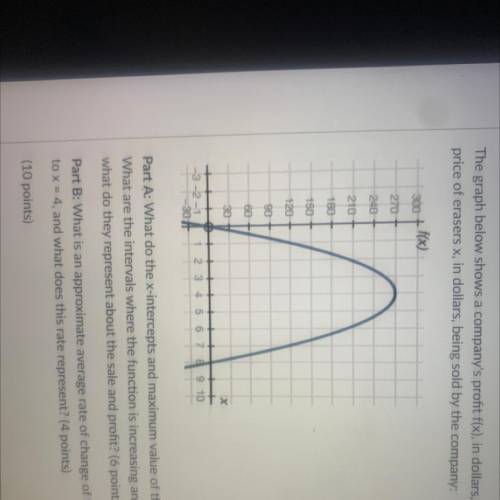
The graph below shows a company's profit f(x), in dollars, depending on the
price of erasers x, in dollars, being sold by the company:
300 + f(x)
270
240
210
180
150
120
90
60 +
30
Part A: What do the x-intercepts and maximum value of the graph represent?
What are the intervals where the function is increasing and decreasing, and
what do they represent about the sale and profit? (6 points)
Part B: What is an approximate average rate of change of the graph from x = 1
to x = 4, and what does this rate represent? (4 points)
(10 points)

Answers: 2


Other questions on the subject: Mathematics
Do you know the correct answer?
The graph below shows a company's profit f(x), in dollars, depending on the
price of erasers x, in...
Questions in other subjects:
Mathematics, 03.03.2021 14:00


Mathematics, 03.03.2021 14:00

Geography, 03.03.2021 14:00
Mathematics, 03.03.2021 14:00
Mathematics, 03.03.2021 14:00


