

Mathematics, 20.04.2021 20:30, KenzieD6032
Select the correct answer.
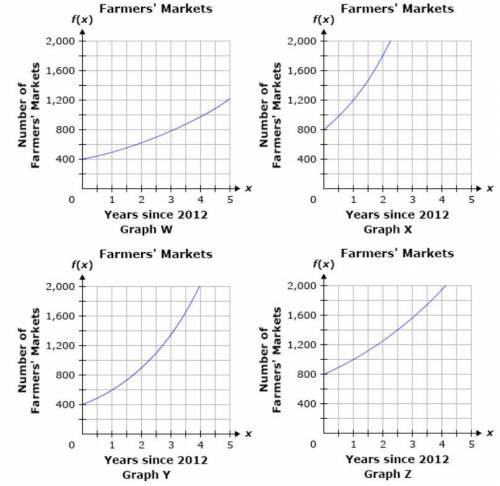
There were 800 farmers' markets initially in the USA in 2012. In 2013, the number of farmers' markets was 1.25 times the initial number of farmers' markets. Then, in 2014, the number of farmers' markets was 1.25 times the number of farmers' markets the previous year. If this pattern continues, which of the following graphs represents the number of farmers' markets in the USA over time?
A. Graph W
B. Graph X
C. Graph Y
D. Graph Z

Answers: 2


Other questions on the subject: Mathematics
Mathematics, 21.06.2019 18:00, jabraeshaw
Which shows the correct solution of the equation 1/2a+2/3b=50, when b=30?
Answers: 1
Mathematics, 21.06.2019 18:30, povijuaisaiah
Use δjkl and δmpn to determine whether don's claim is true or false. which of the following should don use to prove the triangles are similar? sss sas aas aa
Answers: 1
Mathematics, 21.06.2019 20:30, phillipfruge3
East black horse $0.25 total budget is $555 it'll cost $115 for other supplies about how many flyers do you think we can buy
Answers: 1
Do you know the correct answer?
Select the correct answer.
There were 800 farmers' markets initially in the USA in 2012. In 2013,...
Questions in other subjects:

Mathematics, 01.04.2020 16:32
Mathematics, 01.04.2020 16:32
Mathematics, 01.04.2020 16:32


Chemistry, 01.04.2020 16:32


