


1. Find the value of the linear coefficient r,
COST 9 2 3 4 2 5 9 10
NUMBER 85 52 55 68 67 8...

Mathematics, 20.04.2021 05:30, nicolemaefahey
1. Find the value of the linear coefficient r,
COST 9 2 3 4 2 5 9 10
NUMBER 85 52 55 68 67 86 83 73
A. 0.708
B. 0.235
C. -0.071
D. 0.246
2. Give the linear coefficient r and the sample size n, determine the critical values of r and use your finding to state whether or not the given r represents a significant linear correlation. Use a significance level of 0.05.
r = 0.75, n = 9
A. Critical values r = +/-0.666, no significant linear correlation
B. Critical values r = = 0.666, no significant linear correlation
C. Critical values r = +/-0.666, significant linear correlation
D. Critical values r = -0.666, no significant linear correlation
3. Find the value of the linear correlation coefficient r.
TEMP 62 76 50 51 71 46 51 44 79
GROWTH 36 39 50 13 33 17 6 16
A. 0
B. 0.196
C. 0.256
D. -0.210
4. Suppose you will perform a test to determine whether there is sufficient evidence to support a claim of a linear correlation between two variables. Find the critical values of R given the number of pairs of data n and the significance level a.
n = 17, r = 0.05
A. r = 0.482
B. r = +/- 0.482
C. r = +/- 0.606
D. r = 0.497
5. Suppose you will perform a test to determine whether there is sufficient evidence to support a claim of a linear correlation between two variables. Find the critical values of R given the number of pairs of data n and the significance level a.
n = 14, a = 0.05
A. r = 0.553
B. r = 0.532
C. r = +/-0.532
D. r = +/- 0,661
6. Use the given data to find the equation of the regression line. Round the final values to three significant digits, if necessary.
X 3 5 7 15 16
Y 8 11 7 14 20
A. y = 4.07 + 0.753x
B. y = 5.07 + 0.850x
C. y = 4.07 + 0.850x
D. y = 5.07 + 0.753x
7. Use the given data to find the best predicted value of the response variable.
Ten pairs of data yield r = 0.003 and the regression equation y = 2 + 3x. Also, y bar = 5.0. What is the best predicted value of y for x = 2 Use a = 0.05.
A. 7.0
B. 17.0
C. 8.0
D. 5.0
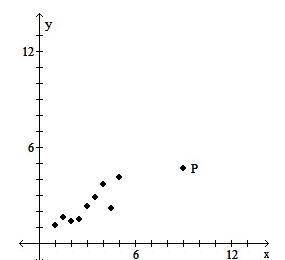
8. Is the data point, P, an outlier, an influential point, both, or neither?
A. Influential point
B. Neither
C. Outlier
D. Both
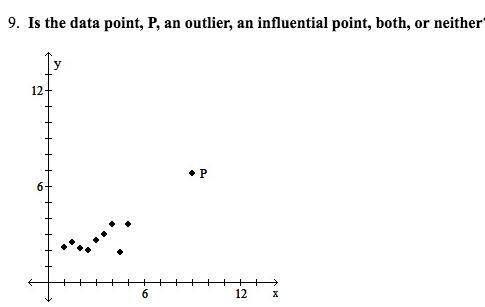
9. Is the data point, P, an outlier, an influential point, both, or neither?
A. Influential point
B. Neither
C. Outlier
D. Both
10. Use the given data to find the equation of the regression line. Round the final values to three significant digits, if necessary.
X 1 3 5 7 9
Y 143 116 100 98 90
A. y = -150.7 + 6.8x
B. y = 140.4 - 6.2x
C. y = -140.4 + 6.2x
D. 150.7 - 6.8x
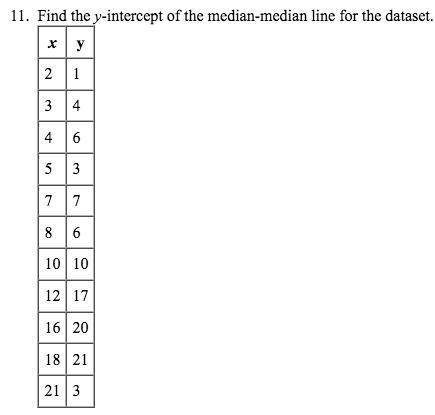
11. Find the y-intercept of the median-median line for the dataset.
A. b = -0.8889
B. b = 1
C. b = 1.1111
D. b = 1.1481
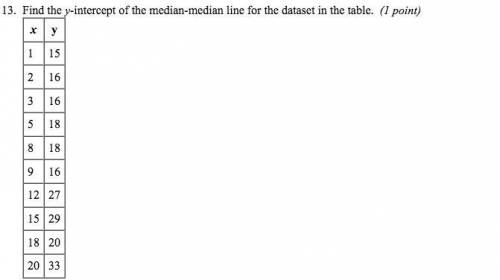
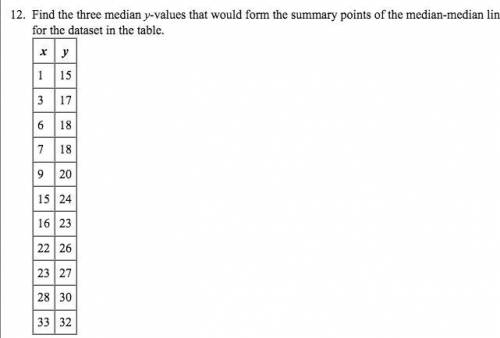
13. Find the y-intercept of the median-median line for the dataset in the table.
A. 6.5
B. 13.3
C. 16.3
D. 10.2
14. The median-median line for a dataset is y = 1.4x + 2.6.
The least-squares regression line for the same dataset is y = 0.9 + 4.2. Which regression equation better predicts the y-value for the point (10, 14)?
A. The median-median line is a better prediction.
B. The least-squares regression line is a better prediction.
C. The models predict the same value.
D. The models predict different values that are equally inaccurate.
15. What is the slope of the median-median line for the dataset in this table?
A. m = -2.5278
B. m = -1.1333
C. m = 1.0833
D. m = 8.4722
16. Construct a scatterplot and identify the mathematical model that best fits the data. Assume the model is to be used only for the scope of the given data and consider only linear, quadratic, logarithmic, exponential, and power models. Use a calculator or computer to obtain the regression equation of the model that best fits the data. You may need to fit several models and compare the values of R^2.
X 1 4 5 9 11 16
Y 9 13 50 300 2000 50000
A. y = 2.35 e^1.82x
B. y = 477.5x^2 - 5269.4x + 9334.1
C. y = 1.69x^2.86
D. y = -10298.6 + 11016 ln x
17. A collection of paired data consists of the number of years that students have studied Spanish and their scores on a Spanish language proficiency test. A computer program was used to obtain the least squares linear regression line and the computer output is shown below. Along with the paired sample data, the program was also given an x value of 2 (years of study) to be used for predicting test scores.
Equation: y = mx + b
Statistics
r^2 = 0.83
r = 0.91
Parameters
m = 10.90
b = 31.55
Answer the following questions based on the information given above.
Use the information in the display to find the value of the linear correlation coefficient r. Determine whether there is significant linear correlation between years of study and test scores. Use a significance level of 0.05. There are 10 pairs of data.
A. r = 0.83; There is no significant linear correlation.
B. r = 0.91; There is no significant linear correlation.
C. r = 0.91; There is significant linear correlation.
D. r = 0.83; There is significant linear correlation.

Answers: 2
Other questions on the subject: Mathematics
Mathematics, 21.06.2019 19:00, nicolemaefahey
How do i start to solve? would appreciate a walk-thru! a bird sitting 16ft above the ground in an apple tree dislodges an apple. after how many seconds does the apple land on the ground? (assuming that no branches will interfere with it's fall)
Answers: 1
Mathematics, 21.06.2019 21:30, fheight01
Name and describe the three most important measures of central tendency. choose the correct answer below. a. the mean, sample size, and mode are the most important measures of central tendency. the mean of a data set is the sum of the observations divided by the middle value in its ordered list. the sample size of a data set is the number of observations. the mode of a data set is its highest value in its ordered list. b. the sample size, median, and mode are the most important measures of central tendency. the sample size of a data set is the difference between the highest value and lowest value in its ordered list. the median of a data set is its most frequently occurring value. the mode of a data set is sum of the observations divided by the number of observations. c. the mean, median, and mode are the most important measures of central tendency. the mean of a data set is the product of the observations divided by the number of observations. the median of a data set is the lowest value in its ordered list. the mode of a data set is its least frequently occurring value. d. the mean, median, and mode are the most important measures of central tendency. the mean of a data set is its arithmetic average. the median of a data set is the middle value in its ordered list. the mode of a data set is its most frequently occurring value.
Answers: 3
Do you know the correct answer?
Questions in other subjects:
Mathematics, 21.01.2020 05:31
Mathematics, 21.01.2020 05:31


