

Mathematics, 24.09.2019 02:30, discolldiane3708
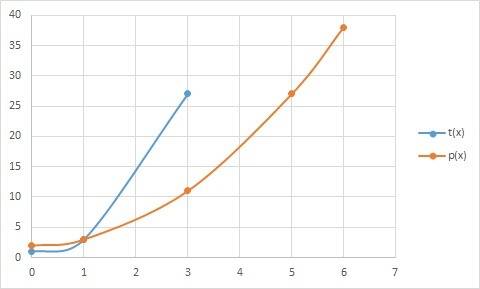
Aquadratic function and an exponential function are graphed below. which graph most likely represents the exponential function? graph of function t of x is a curve which joins the ordered pair 0, 1 and 1, 3 and 3, 27. graph of function p of x is a curve which joins the ordered pair 0, 2 and 1, 3 and 3, 11 and 5, 27 and 6, 38

Answers: 1


Other questions on the subject: Mathematics
Mathematics, 21.06.2019 17:30, hiiliohi9433
One integer is 5 more than another. their product is 104. find the integers
Answers: 2
Mathematics, 21.06.2019 18:00, sydneydavis57
Jacob signs up to work for 2 1/2 hours at the school carnival. if each work shift is 3/4 hour, how many shifts will jacob work? (i just want to double check : |, for anybody that responds! : )
Answers: 3
Mathematics, 21.06.2019 20:30, officialgraciela67
William invested $5000 in an account that earns 3.8% interest, compounded annually. the formula for compound interest is a(t) = p(1 + i)t. how much did william have in the account after 6 years? (apex)
Answers: 2
Do you know the correct answer?
Aquadratic function and an exponential function are graphed below. which graph most likely represent...
Questions in other subjects:
Mathematics, 12.02.2021 20:00
Mathematics, 12.02.2021 20:00

Social Studies, 12.02.2021 20:00
Mathematics, 12.02.2021 20:00
Mathematics, 12.02.2021 20:00

History, 12.02.2021 20:00
Mathematics, 12.02.2021 20:00
Mathematics, 12.02.2021 20:00


