


Ted and meg have each drawn a line on the scatter plot shown below:
which line best represent...

Mathematics, 14.11.2019 06:31, eddiewoods56881
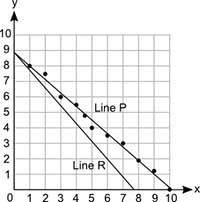
Ted and meg have each drawn a line on the scatter plot shown below:
which line best represents the line of best fit?
line p, because it is closest to most data points
line p, because it shows a positive association
line r, because it is closest to most data points
line r, because it shows a negative association

Answers: 3
Other questions on the subject: Mathematics
Mathematics, 20.06.2019 18:02, cassandramanuel
There are 96 raisins and 24 cashews in each package of granola. what is the unit rate in raisins per cashew? plz 4122096
Answers: 1
Mathematics, 21.06.2019 17:00, landenDfisher
For the rule of 78, for a 12-month period, the last term in the sequence is 12 and the series sums to 78. for an 10 month period, the last term is and the series sum is . for a 15 month period, the last term is and the series sum is . for a 20 month period, the last term is and the series sum is
Answers: 2
Mathematics, 21.06.2019 21:30, bryantfoster
Helll ! 1,400 tons of wheat of two different varieties was delivered to the silo. when processing one variety, there was 2% of waste and 3% during the processing of the second variety of wheat. after the processing, the amount of remaining wheat was 1,364 tons. how many tons of each variety of wheat was delivered to the silo?
Answers: 1
Do you know the correct answer?
Questions in other subjects:
Mathematics, 18.08.2019 23:30


Biology, 18.08.2019 23:30

History, 18.08.2019 23:30
History, 18.08.2019 23:30
Mathematics, 18.08.2019 23:30
Mathematics, 18.08.2019 23:30
Mathematics, 18.08.2019 23:30


