

Mathematics, 17.10.2019 19:00, garciagang0630
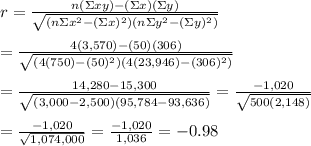
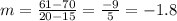
The table below shows the surface area y, in square feet, of a shrinking lake in x days: time (x) (days) 5 10 15 20 surface area (y) (square feet) 90 85 70 61 part a: what is the most likely value of the correlation coefficient of the data in the table? based on the correlation coefficient, describe the relationship between time and surface area of the lake. [choose the value of the correlation coefficient from −1, −0.98, −0.5, −0.02.] (4 points) part b: what is the value of the slope of the graph of surface area versus time between 15 and 20 days, and what does the slope represent? (3 points) part c: does the data in the table represent correlation or causation? explain your answer. (3 points)

Answers: 3
![\begin{center} \begin{tabular} {|c|c|c|c|c|} x & y & x^2 & y^2 & xy \\ [1ex] 5 & 90 & 25 & 8,100 & 450\\ 10 & 85 & 100 & 7,225 & 850\\ 15 & 70 & 225 & 4,900 & 1,050\\ 20 & 61 & 400 & 3,721 & 1,220\\ [1ex] \Sigma x=50 & \Sigma y=306 & \Sigma x^2=750 & \Sigma y^2=23,946 & \Sigma xy=3,570 \end{tabular} \end{center}](/tpl/images/0329/1081/d0719.png)
 and
and 


Other questions on the subject: Mathematics
Mathematics, 21.06.2019 18:00, Mrlittlefish
What is the location of point g, which partitions the directed line segment from d to f into a 5: 4 ratio? –1 0 2 3
Answers: 1
Mathematics, 21.06.2019 19:30, shanua
Needmax recorded the heights of 500 male humans. he found that the heights were normally distributed around a mean of 177 centimeters. which statements about max’s data must be true? a) the median of max’s data is 250 b) more than half of the data points max recorded were 177 centimeters. c) a data point chosen at random is as likely to be above the mean as it is to be below the mean. d) every height within three standard deviations of the mean is equally likely to be chosen if a data point is selected at random.
Answers: 2
Mathematics, 21.06.2019 20:40, kaylabethany
How is the equation of this circle written in standard form? x2 + y2 - 6x + 14y = 142 a) (x - 3)2 + (y + 7)2 = 200 b) (x+ 3)2 + (y - 7)2 = 200 (x - 6)2 + (y + 14)2 = 142 d) (x+6)2 + (y- 14)2 = 142
Answers: 1
Do you know the correct answer?
The table below shows the surface area y, in square feet, of a shrinking lake in x days: time (x) (...
Questions in other subjects:

Mathematics, 14.03.2022 08:10


Computers and Technology, 14.03.2022 08:10

History, 14.03.2022 08:10

Mathematics, 14.03.2022 08:10


