

Mathematics, 17.11.2019 09:31, sarai47
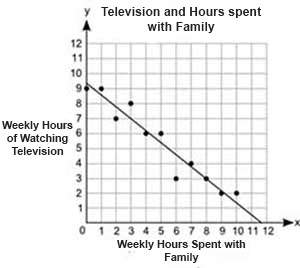
The scatter plot shows the relationship betweeen the number of hours students spend watching television and the numer of hours they spend with family each week.
what is the y-intercept of the line of best fit and what does it represent?
11.5 hours; the number of hours students spend with family in a week when they do not watch television
9.2 hours; the number of hours students watch television in a week when they do not spend time with family
9.2 hours; the number of hours students spend with family in a week when they do not watch television
11.5 hours; the number of hours students watch television in a week when they do not spend time with family

Answers: 1


Other questions on the subject: Mathematics
Mathematics, 21.06.2019 16:00, blackbetty79
Ernest is purchasing a $175,000 home with a 30-year mortgage. he will make a $15,000 down payment. use the table below to find his monthly pmi payment.
Answers: 2
Mathematics, 21.06.2019 18:30, 2024daisjavien
For this option, you will work individually. the pythagorean theorem can be used in many real-world scenarios. part 1 write your own real-world scenario where the pythagorean theorem can be applied to find a missing piece. you may choose to write a problem that is two- or three-dimensional in nature. be sure that you will be able to draw a diagram of your scenario. write out your problem and submit it for part 1. be sure to end your scenario with a question. part 2 draw a diagram of the scenario you created in part 1. you may draw by hand and scan and upload your drawing or create a computer-generated drawing for submission. be sure to label all parts and dimensions of the drawing. part 3 solve the question that you posed in part 1. show all of your steps in answering the question. for this option, you will need to submit all three parts for full credit—your real-world problem and question, the diagram that you created, and your work solving the problem, showing all steps. * note that your instructor is looking for your own original idea. while it is acceptable to use the internet for research and inspiration, academic integrity policies apply.
Answers: 1
Mathematics, 22.06.2019 02:20, queenmari49
Find the measure of angle b in the following triangle
Answers: 1
Mathematics, 22.06.2019 02:30, lisnel
Aconstruction worker needs to put a rectangular window in the side of a building he knows from measuring that the top and bottom of the window have a width of 8bfeet and the sides have a length of 15 feet he also measured one diagonal to be 17 feet what is the length of the other diagonal
Answers: 1
Do you know the correct answer?
The scatter plot shows the relationship betweeen the number of hours students spend watching televis...
Questions in other subjects:


English, 19.03.2020 10:05


