


Need fast!
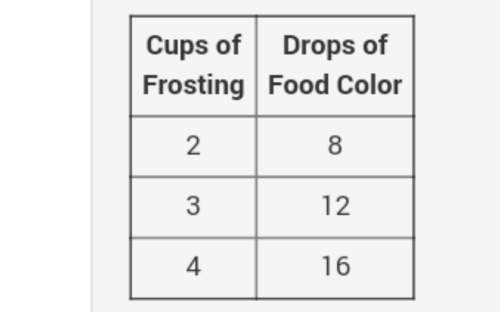
the table shows the relationship between the number of drops of food color added...

Mathematics, 07.12.2019 18:31, aclm2001
Need fast!
the table shows the relationship between the number of drops of food color added to different number of cups of cake frosting. look at the first picture.
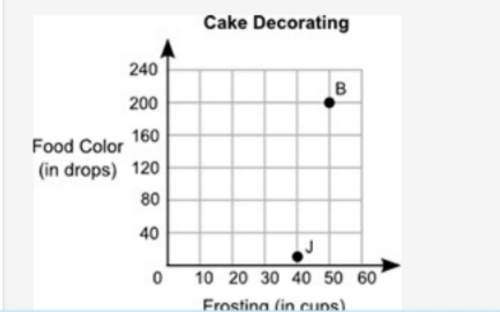
which point below shows an equivalent ratio in this situation? look at the second picture.
a. point b, because if cups of frosting are 50, then drops of food coloring will be 200
b. point b, because if drops of food coloring are 50, then cups of frosting will be 200
c. point j, because if cups of frosting are 40, then drops of food coloring will be 10
d. point j, because if drops of food coloring are 40, then cups of frosting will be 10

Answers: 1
Similar questions
Mathematics, 30.06.2019 06:50, jacksonsmith0
Answers: 3
Mathematics, 18.10.2019 01:30, magaaalimartinez
Answers: 3
Mathematics, 28.10.2019 22:31, GracieMaeB
Answers: 2
Do you know the correct answer?
Questions in other subjects:

Social Studies, 06.07.2019 12:50
Mathematics, 06.07.2019 12:50


Social Studies, 06.07.2019 12:50


