

Mathematics, 19.10.2019 15:30, dunk36
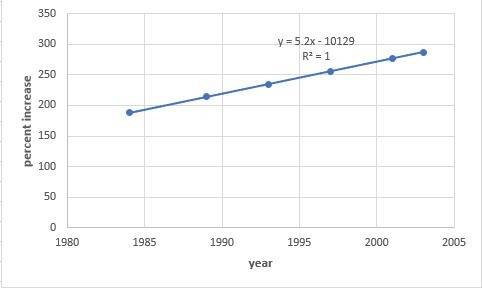
The following table shows the percent increase of donations made on behalf of a non-profit organization for the period of 1984 to 2003. use a graphing calculator to make a scatter plot of the data. find an equation for and graph the line of regression. then use the equation to predict the percent donated in the year 2015.
year
1984
1989
1993
1997
2001
2003
percent
187.9 213.9 234.7 255.5 276.3 286.7

Answers: 3


Similar questions
Mathematics, 16.09.2019 18:30, jalaholmes2027
Answers: 1
Mathematics, 24.10.2019 06:43, nick5442
Answers: 1
Do you know the correct answer?
The following table shows the percent increase of donations made on behalf of a non-profit organizat...
Questions in other subjects:

Mathematics, 02.12.2019 23:31
Mathematics, 02.12.2019 23:31
Mathematics, 02.12.2019 23:31

English, 02.12.2019 23:31
Mathematics, 02.12.2019 23:31


