


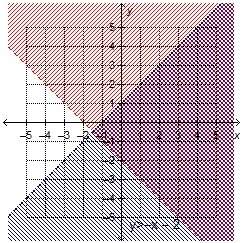
Which linear inequality is graphed with y > –x – 2 to create the given solution set?
a=y...

Mathematics, 20.09.2019 22:00, Lujfl
Which linear inequality is graphed with y > –x – 2 to create the given solution set?
a=y > x + 1
b=y < x – 1
c=y > x – 1
d=y < x + 1

Answers: 2
Other questions on the subject: Mathematics
Mathematics, 21.06.2019 19:30, jasminetaylor4587
According to the data set, where should the upper quartile line of the box plot be placed?
Answers: 1
Do you know the correct answer?
Questions in other subjects:

Health, 26.03.2020 15:30
Mathematics, 26.03.2020 15:31

Mathematics, 26.03.2020 15:31

Chemistry, 26.03.2020 15:31
Health, 26.03.2020 15:31
Chemistry, 26.03.2020 15:32


