


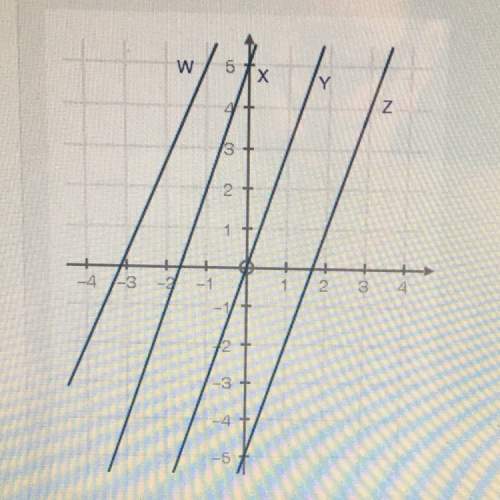
The graph below shows four straight lines, w, x, y, and z.
which line is represented by the fu...

Mathematics, 28.08.2019 20:40, esmemaluma00
The graph below shows four straight lines, w, x, y, and z.
which line is represented by the function f(x) = 3x + 5?
a: line w
b: line x
c: line y
d: line z

Answers: 1
Other questions on the subject: Mathematics
Mathematics, 21.06.2019 16:30, jlewis711777
What are “like terms”? why can we only add like terms?
Answers: 1
Mathematics, 21.06.2019 22:10, carsondelane13
Monitors manufactured by tsi electronics have life spans that have a normal distribution with a standard deviation of 1800 hours and a mean life span of 20,000 hours. if a monitor is selected at random, find the probability that the life span of the monitor will be more than 17,659 hours. round your answer to four decimal places.
Answers: 2
Mathematics, 21.06.2019 23:00, Pankhud5574
Is a square always, sometimes, or never a parallelogram
Answers: 2
Mathematics, 22.06.2019 00:00, bri9263
(20 points) a bank has been receiving complaints from real estate agents that their customers have been waiting too long for mortgage confirmations. the bank prides itself on its mortgage application process and decides to investigate the claims. the bank manager takes a random sample of 20 customers whose mortgage applications have been processed in the last 6 months and finds the following wait times (in days): 5, 7, 22, 4, 12, 9, 9, 14, 3, 6, 5, 15, 10, 17, 12, 10, 9, 4, 10, 13 assume that the random variable x measures the number of days a customer waits for mortgage processing at this bank, and assume that x is normally distributed. 2a. find the sample mean of this data (x ě…). 2b. find the sample variance of x. find the variance of x ě…. for (c), (d), and (e), use the appropriate t-distribution 2c. find the 90% confidence interval for the population mean (îľ). 2d. test the hypothesis that îľ is equal to 7 at the 95% confidence level. (should you do a one-tailed or two-tailed test here? ) 2e. what is the approximate p-value of this hypothesis?
Answers: 2
Do you know the correct answer?
Questions in other subjects:

Mathematics, 19.03.2020 17:27


Biology, 19.03.2020 17:28


