

Mathematics, 05.12.2019 10:31, tttyson
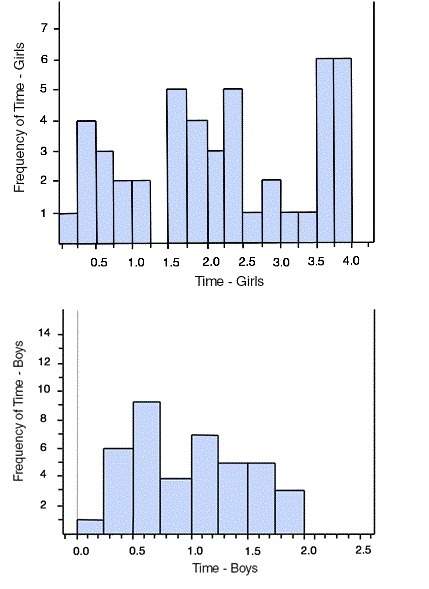
These histograms graph the amount of time (hours per day) that 46 middle school girls and 40 middle school boys in san francisco spend on the website facespace. 50 boys and 50 girls took the survey but 4 girls and 10 boys did not use these sites at all. each is graphed with a bar width of 0.25 hours.
how many boys spent between 0.5 hour and 0.75 hour on the site?
6
8
9
10

Answers: 3


Other questions on the subject: Mathematics
Mathematics, 21.06.2019 12:30, brittany7436
What is the exact volume of the cylinder? 16in going into the middle of the top of the cylinder and 40in in height a) 25,600(pi)3 b)10,240(pi)3 c)1280(pi)3 d)640(pi)3
Answers: 1
Mathematics, 22.06.2019 00:00, valenciadewalt25
As a salesperson you get $50/day and $3.60/each sales you make. if you want to make $60 in one day, how many sales would you need need to make ? a 3b 4c 5d 6 show work.
Answers: 1
Do you know the correct answer?
These histograms graph the amount of time (hours per day) that 46 middle school girls and 40 middle...
Questions in other subjects:
Mathematics, 21.12.2020 23:20


Chemistry, 21.12.2020 23:20

Mathematics, 21.12.2020 23:20

Arts, 21.12.2020 23:20


