


20 points two
1. a scatter plot with a line is shown below.
[graph shows numbers from...

Mathematics, 17.09.2019 07:00, hartzpeyton136
20 points two
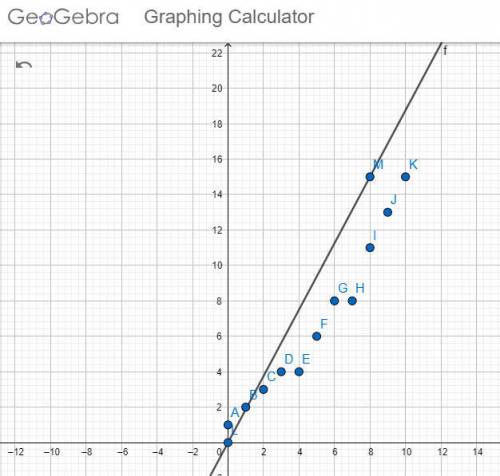
1. a scatter plot with a line is shown below.
[graph shows numbers from 0 to 10 at increments of 1 on the x axis and number s from 0 to 15 at increments of 1 on the y axis. scatter plot shows ordered pairs 0, 1 and 1, 2 and 2, 3 and 3,4 and 4, 4 and 5, 6 and 6, 8 and 7, 8 and 8, 11 and 9, 13 and 10, 15. a line joins ordered pairs 0, 0 and 8, 15.]
which statement is most likely correct about the line?
[i think the answer is a]
it can be the line of best fit because it is closest to most data points.
it can be the line of best fit because it passes through all the scatter points.
it cannot be the line of best fit because it does not show positive association.
it cannot be the line of best fit because it is not closest to most of the points.
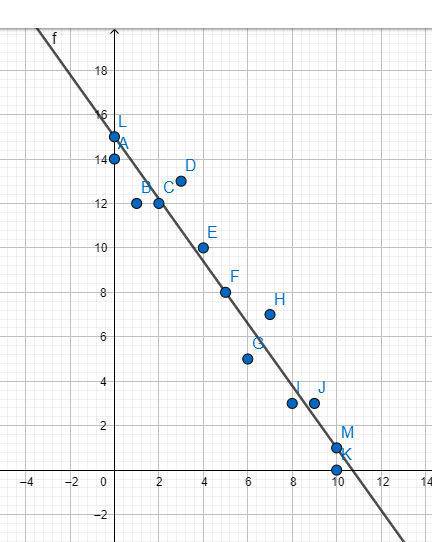
2. a scatter plot is shown below:
[a graph shows numbers from 0 to 10 on the x axis at increments of 1 and the numbers 0 to 15 on the y axis at increments of 1. the ordered pairs 0, 14 and 1, 12 and 2, 12 and 3, 13 and 4, 10 and 5, 8 and 6, 5 and 7, 7 and 8, 3 and 9, 3 and 10, 0 are shown on the graph.]
which two ordered pairs can be joined to best draw the line of best fit for this scatter plot?
[i think the answer is a]
(0, 15) and (10, 1)
(0, 15) and (10, 13)
(0, 10) and (5, 0)
(0, 10) and (10, 10)

Answers: 1
Other questions on the subject: Mathematics
Mathematics, 22.06.2019 00:00, ivanmmmm
The construction of copying qpr is started below. the next step is to set the width of the compass to the length of ab. how does this step ensure that a new angle will be congruent to the original angle? by using compass take the measures of angle and draw the same arc according to it.
Answers: 2
Mathematics, 22.06.2019 01:40, Anshuman2002
(co 3) the soup produced by a company has a salt level that is normally distributed with a mean of 5.4 grams and a standard deviation of 0.3 grams. the company takes readings of every 10th bar off the production line. the reading points are 5.8, 5.9, 4.9, 6.5, 5.0, 4.9, 6.2, 5.1, 5.7, 6.1. is the process in control or out of control and why? it is out of control as two of these data points are more than 2 standard deviations from the mean it is in control as the data points more than 2 standard deviations from the mean are far apart it is out of control as one of these data points is more than 3 standard deviations from the mean it is in control as the values jump above and below the mean
Answers: 2
Mathematics, 22.06.2019 03:00, sarath30
This size running track is usually called a 400 meter track. however if a person ran as close to the inside as possible on the track they would run less than 400 meters in one lap. how far away from the inside border would someone have to run to make one lap equal exactly 400 meters
Answers: 2
Mathematics, 22.06.2019 04:00, heavyhearttim
The perimeter of △cde is 55 cm. a rhombus dmfn is inscribed in this triangle so that vertices m, f, and n lie on the sides cd , ce , and de respectively. find cd and de if cf=8 cm and ef=12 cm. the answer is not cd=20 and de=15. i have tried that one, it does not work.
Answers: 1
Do you know the correct answer?
Questions in other subjects:
Mathematics, 04.06.2021 14:00

Computers and Technology, 04.06.2021 14:00

English, 04.06.2021 14:00

Health, 04.06.2021 14:00
Mathematics, 04.06.2021 14:00

Physics, 04.06.2021 14:00
Mathematics, 04.06.2021 14:00

Spanish, 04.06.2021 14:00
Health, 04.06.2021 14:00


