

Mathematics, 11.11.2019 21:31, xmiice1981
If the midpoint between (x, 6) and (-9, 14) is (8, 10), find the value of x

Answers: 3
 is 25.
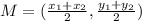


Other questions on the subject: Mathematics
Mathematics, 21.06.2019 23:40, kamdenburr
Sanjay solved the equation below. which property did he use to determine that 7x+42=42 is equivalent to 7(x+6)=42 7x+42=42 7x=0 x=0
Answers: 1
Mathematics, 22.06.2019 00:30, swaggsuperman713
(i really need ) read the story problem, and then answer the questions that follow. gordon works for a graphic design firm and is creating a label for a food truck vendor. the vendor specializes in finger food and wants to sell food in right conical containers so that they are easy for people to hold. to complete his label, gordon needs to collect several different measurements to ensure that the label he designs will fit the surface of the container. gordon has been told that the containers have a diameter of 4 inches and a height of 6 inches. part a: find the slant height of the cone. the slant height is the distance from the apex, or tip, to the base along the cone’s lateral surface. show your work. part b: find the measure of the angle formed between the base of the cone and a line segment that represents the slant height. part c: imagine two line segments where each represents a slant height of the cone. the segments are on opposite sides of the cone and meet at the apex. find the measurement of the angle formed between the line segments.
Answers: 1
Mathematics, 22.06.2019 01:00, autumnrose02
Anew landowner is interested in constructing a fence around the perimeter of her property. her property is 1,080√30 feet wide and 500√20 feet long. what is the perimeter of the property? (recall that the perimeter is the sum of each side of a shape or boundary). a 1,580√40 feet b. 5,320√5 feet c. 3,160√20 feet d. 10,640√5 feet
Answers: 3
Mathematics, 22.06.2019 01:00, s27511583
The weight of 46 new patients of a clinic from the year 2018 are recorded and listed below. construct a frequency distribution, using 7 classes. then, draw a histogram, a frequency polygon, and an ogive for the data, using the relative information from the frequency table for each of the graphs. describe the shape of the histogram. data set: 130 192 145 97 100 122 210 132 107 95 210 128 193 208 118 196 130 178 187 240 90 126 98 194 115 212 110 225 187 133 220 218 110 104 201 120 183 124 261 270 108 160 203 210 191 180 1) complete the frequency distribution table below (add as many rows as needed): - class limits - class boundaries - midpoint - frequency - cumulative frequency 2) histogram 3) frequency polygon 4) ogive
Answers: 1
Do you know the correct answer?
If the midpoint between (x, 6) and (-9, 14) is (8, 10), find the value of x...
Questions in other subjects:
Mathematics, 20.04.2021 18:00

Mathematics, 20.04.2021 18:00
Mathematics, 20.04.2021 18:00

History, 20.04.2021 18:00
Mathematics, 20.04.2021 18:00


