

Mathematics, 16.09.2019 22:00, Harms
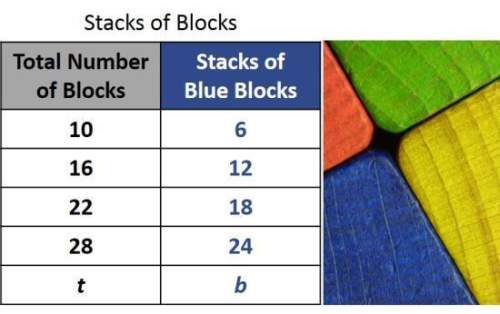
The table above shows the relationship between the number of blue blocks (b) and the total number of blocks (t) in a stack. which of the following equations best represents the relationship in the table? a, t = b − 4 b. t = b + 6 c. t = b × 2 d. t = b + 4

Answers: 1


Other questions on the subject: Mathematics
Mathematics, 21.06.2019 15:30, nsuleban9524
Astore manager records the total visitors and sales, in dollars, for 10 days. the data is shown in the scatter plot. what conclusion can the store manager draw based on the data? question 3 options: an increase in sales causes a decrease in visitors. an increase in sales is correlated with a decrease in visitors. an increase in visitors is correlated with an increase in sales.
Answers: 1
Mathematics, 21.06.2019 16:30, reyesortiz6955
Its due ! write an equation in which the quadratic expression 2x^2-2x 12 equals 0. show the expression in factored form and explain what your solutions mean for the equation. show your work.
Answers: 1
Mathematics, 21.06.2019 17:30, corinaartsy
Match each function with its rate of growth or decay
Answers: 1
Do you know the correct answer?
The table above shows the relationship between the number of blue blocks (b) and the total number of...
Questions in other subjects:

History, 06.06.2020 18:01
Mathematics, 06.06.2020 18:01


