


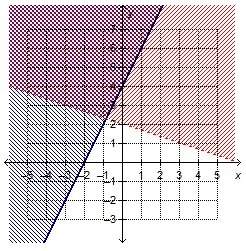
Which system of linear inequalities is represented by the graph?
x – 3y > 6 and y > 2...

Mathematics, 21.09.2019 01:30, alexamorantess
Which system of linear inequalities is represented by the graph?
x – 3y > 6 and y > 2x + 4
x + 3y > 6 and y > 2x – 4
x – 3y > 6 and y > 2x – 4
x + 3y > 6 and y > 2x + 4

Answers: 2
Other questions on the subject: Mathematics
Mathematics, 21.06.2019 20:00, xxaurorabluexx
Credit card a offers an introductory apr of 3.4% for the first three months and standard apr of 15.7% thereafter,
Answers: 3
Mathematics, 21.06.2019 22:30, jordan7626
Find the condition that the zeros of the polynomial f(x) = x^3+3px^2+3px+r may be in a. p.
Answers: 1
Mathematics, 22.06.2019 03:00, 19mcgough
Harold wrote this equation to model the level of water in a pool over time. the variable x represents time in hours. f(x) = 3,500 - 225x which statements about the situation are true? check all that apply. the water level is rising. the water level is falling. the initial level of water in the pool was 3,500 units. the initial level of water in the pool was 225 units. the pool was empty after 14 hours. the water was 2,600 units high after 4 hours.
Answers: 2
Do you know the correct answer?
Questions in other subjects:

Mathematics, 04.02.2020 21:53

Mathematics, 04.02.2020 21:53

Biology, 04.02.2020 21:53
Mathematics, 04.02.2020 21:53
Mathematics, 04.02.2020 21:53


