

Mathematics, 14.10.2019 16:30, kenz2797
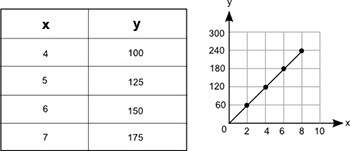
The table and the graph below each show a different relationship between the same two variables, x and y: a table with two columns and 5 rows is shown. the column head for the left column is x, and the column head for the right column is y. the row entries in the table are 4 comma 100 and 5 comma 125 and 6 comma 150 and 7 comma 175. on the right of this table is a graph. the x-axis values are from 0 to 10 in increments of 2 for each grid line. the y-axis values on the graph are from 0 to 300 in increments of 60 for each grid line. a line passing through the ordered pairs 2 comma 60 and 4 comma 120 and 6 comma 180 and 8 comma 240 is drawn. how much more would the value of y be on the graph than its value in the table when x = 12?

Answers: 2


Other questions on the subject: Mathematics
Mathematics, 21.06.2019 17:40, JordanJones04402
Given f(x)= 9x+1 and g(x)=x^3, choose the expression (f*g)(x)
Answers: 2
Mathematics, 21.06.2019 20:00, soniah
Pepe and leo deposits money into their savings account at the end of the month the table shows the account balances. if there pattern of savings continue and neither earns interest nor withdraw any of the money , how will the balance compare after a very long time ?
Answers: 1
Do you know the correct answer?
The table and the graph below each show a different relationship between the same two variables, x a...
Questions in other subjects:


History, 15.11.2019 17:31


