

Mathematics, 17.09.2019 03:50, jellybellyje
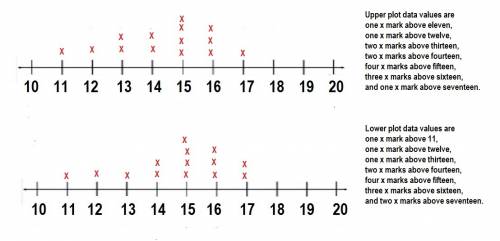
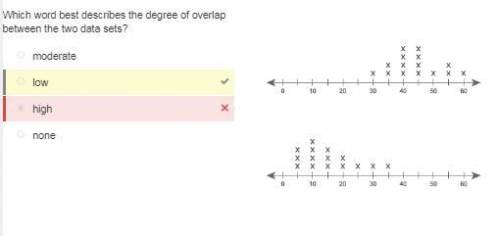
Which word best describes the degree of overlap between the two data sets? moderate none high low two line plots with the same scale and interval, from ten to twenty, with tick marks every one unit. the plots are stacked vertically for comparison. each plot has fourteen data values. values appear as x marks above the line. upper plot data values are one x mark above eleven, one x mark above twelve, two x marks above thirteen, two x marks above fourteen, four x marks above fifteen, three x marks above sixteen, and one x mark above seventeen. lower plot data values are one x mark above 11, one x mark above twelve, one x mark above thirteen, two x marks above fourteen, four x marks above fifteen, three x marks above sixteen, and two x marks above seventeen.

Answers: 2


Other questions on the subject: Mathematics
Mathematics, 21.06.2019 16:30, jessica01479
Scale factor of 2 is used to enlarge a figure as shown below the area of is 18 in.²
Answers: 3
Mathematics, 21.06.2019 18:40, stephen4438
Which of the following represents the range of the graph of f(x) below
Answers: 1
Do you know the correct answer?
Which word best describes the degree of overlap between the two data sets? moderate none high low t...
Questions in other subjects:


History, 02.09.2019 01:20
History, 02.09.2019 01:20


Social Studies, 02.09.2019 01:20

French, 02.09.2019 01:20
History, 02.09.2019 01:20


