
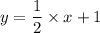
 i.e. y = one half x + 1
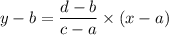


*! 27 ! **
the line of best fit for a scatter plot is shown:
1. a scatter plot...

Mathematics, 29.09.2019 21:00, tioneetionee2188
*! 27 ! **
the line of best fit for a scatter plot is shown:
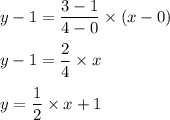
1. a scatter plot and line of best fit are shown. data points are located at 0 and 1, 2 and 1, 2 and 3, 4 and 3, 4 and 5, 6 and 3, 7 and 5, 9 and 4. a line of best fit passes through the y-axis at 1 and through the point 4 and 3.
what is the equation of this line of best fit in slope-intercept form?
y = 1x + one half
y = one half x + 1
y = 1x − one half
y = negative one half x + 1
2. a graph shows the survey results for a group of students who were asked how many honors classes they have taken and how many elective classes:
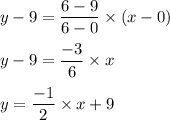
a scatter plot is shown with the title class choices. the x axis is labeled number of honors classes and the y axis is labeled number of electives. data points are located at 1 and 8, 3 and 6, 3 and 9, 5 and 3, 6 and 6, 6 and 9, 8 and 6. a line of best fit crosses the y axis at 9 and passes through the point 6 and 6.
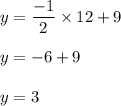
how many elective classes would students likely have taken if they have taken 12 honors classes?
15, because y = one halfx + 9
12, because y = y = negative one halfx + 9
6, y = ˜one halfx + 9
3, because y = negative one halfx + 9

Answers: 2
Other questions on the subject: Mathematics
Mathematics, 21.06.2019 18:20, Karamatullah
The number if marbles of different colors stored in a hat is listed below: 4 red marbles 10 green marbles 7 blue marbles. without looking in the hat, dan takes out a marble at random. he replaces the marble and then takes out another marble from the hat. what is the probability that dan takes out a blue marble in both draws?
Answers: 1
Do you know the correct answer?
Questions in other subjects:
Mathematics, 22.03.2021 03:40
Mathematics, 22.03.2021 03:40

Advanced Placement (AP), 22.03.2021 03:40

Physics, 22.03.2021 03:40

Spanish, 22.03.2021 03:40


Mathematics, 22.03.2021 03:40
English, 22.03.2021 03:40


