

Mathematics, 13.11.2019 06:31, mazz1041
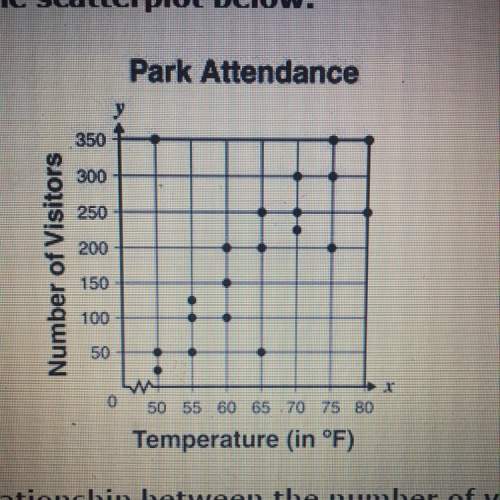
Mr. sanchez recorded the number of visitors to a county park for 20 days and the average temperature for these 20 days. he recorded his data on the scatterplot below.
which statement best describes the relationship between the number of visitors and the average temperature for these 20 days?
a) as the temperature increased, the number of visitors increased
b) as the temperature decreased, the number of visitors increased
c) as the temperature decreased, the number of visitors remained constant
d) as the temperature increased, the number of visitors decreased

Answers: 3


Other questions on the subject: Mathematics
Mathematics, 21.06.2019 17:00, KendallTishie724
In the given figure ar(adf) =ar(cda) and ar(cdf) = ar(cdf). show that abdc and cdfe are trapeziums.
Answers: 2
Mathematics, 21.06.2019 21:00, PotatoBananad
Given: circle o, cd is diameter, chord ab || cd. arc ab = 74°, find arc ca.
Answers: 1
Mathematics, 21.06.2019 22:00, NetherisIsTheQueen
You can ride your bike around your block 6 times and the whole neighborhood 5 times in 16 minutes. you can ride your bike around your block 3 times and the whole neighborhood 10 times in 23 minutes. how long does it take you to ride around the neighborhood?
Answers: 2
Do you know the correct answer?
Mr. sanchez recorded the number of visitors to a county park for 20 days and the average temperature...
Questions in other subjects:
Mathematics, 22.01.2021 21:30

Biology, 22.01.2021 21:30
Mathematics, 22.01.2021 21:30
Mathematics, 22.01.2021 21:30

English, 22.01.2021 21:30

French, 22.01.2021 21:30


